
Tested. Then tested again.
Calculations are checked against known answers and real schedule files. Repeatable tests help catch discrepancies as the analysis evolves.
Schedule decisions deserve analysis you can rely on. Our calculations are repeatedly tested and validated, with findings traced to the activities behind them. Review your P6 or MS Project schedule with evidence you can inspect — and your file kept on your computer.
Every number is worked out again from the activities and links underneath — nothing is copied from what the file claims about itself. Each result is shown with the sums behind it, checked against the DCMA, GAO, AACE and PMI standards. The P6 XER or MS Project XML is read inside your own browser and is never uploaded.
Find your next view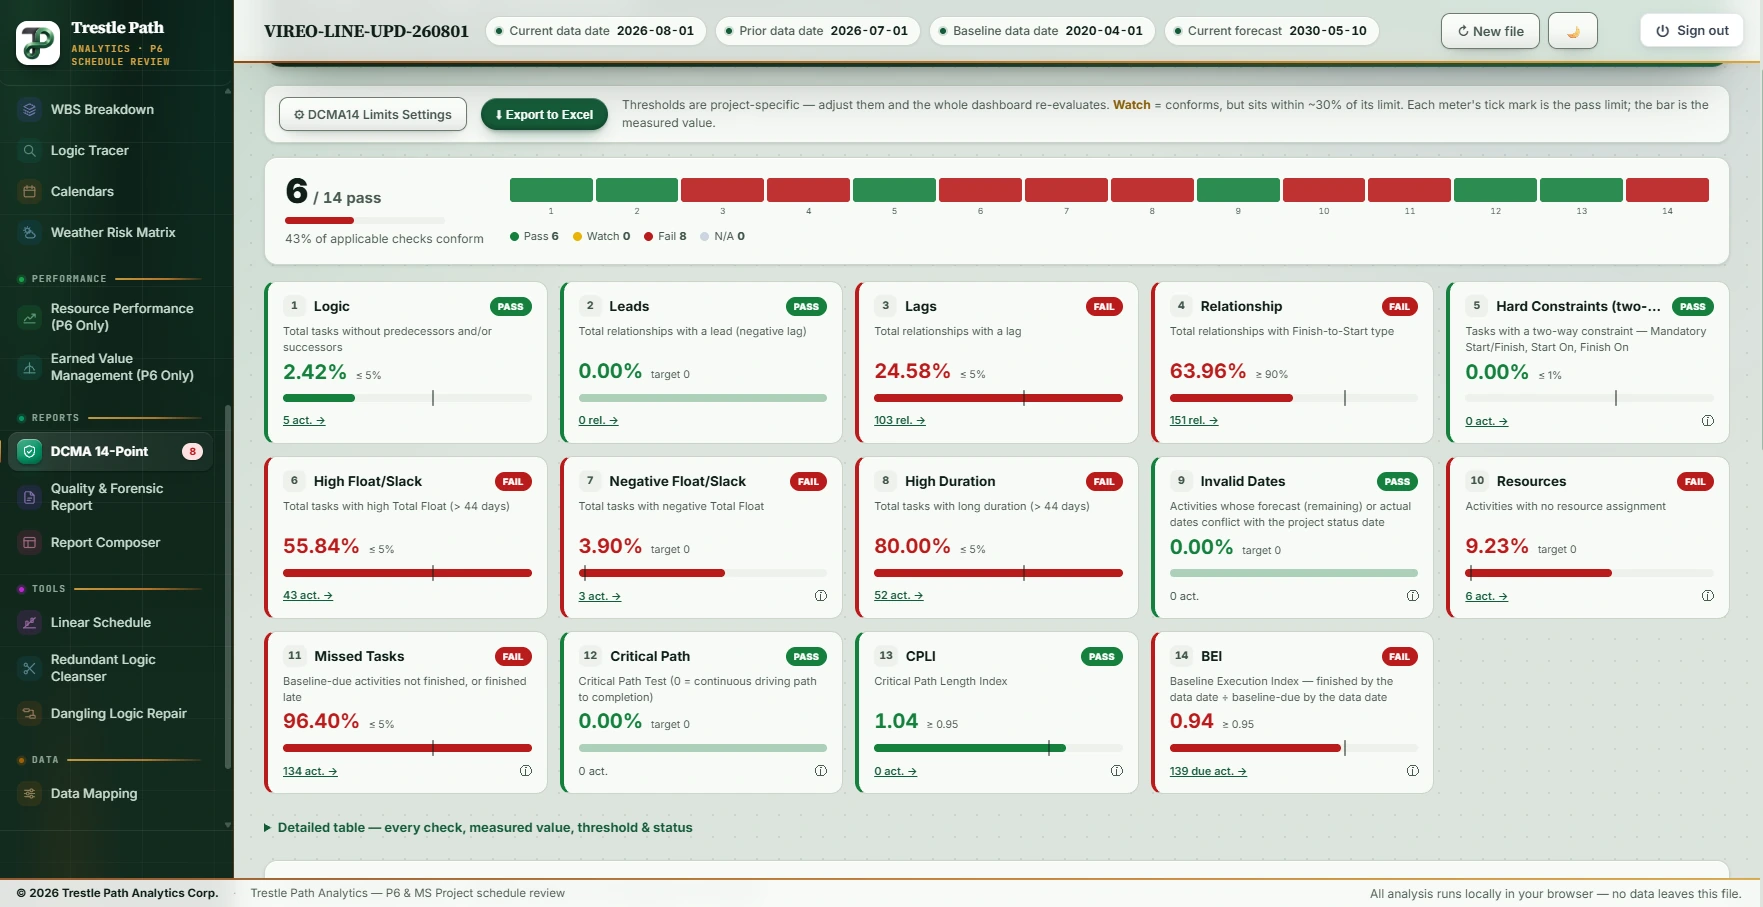 Quality & critical pathDCMA 14-Point Assessment
 Changes & delaysDelay Analysis & Validation
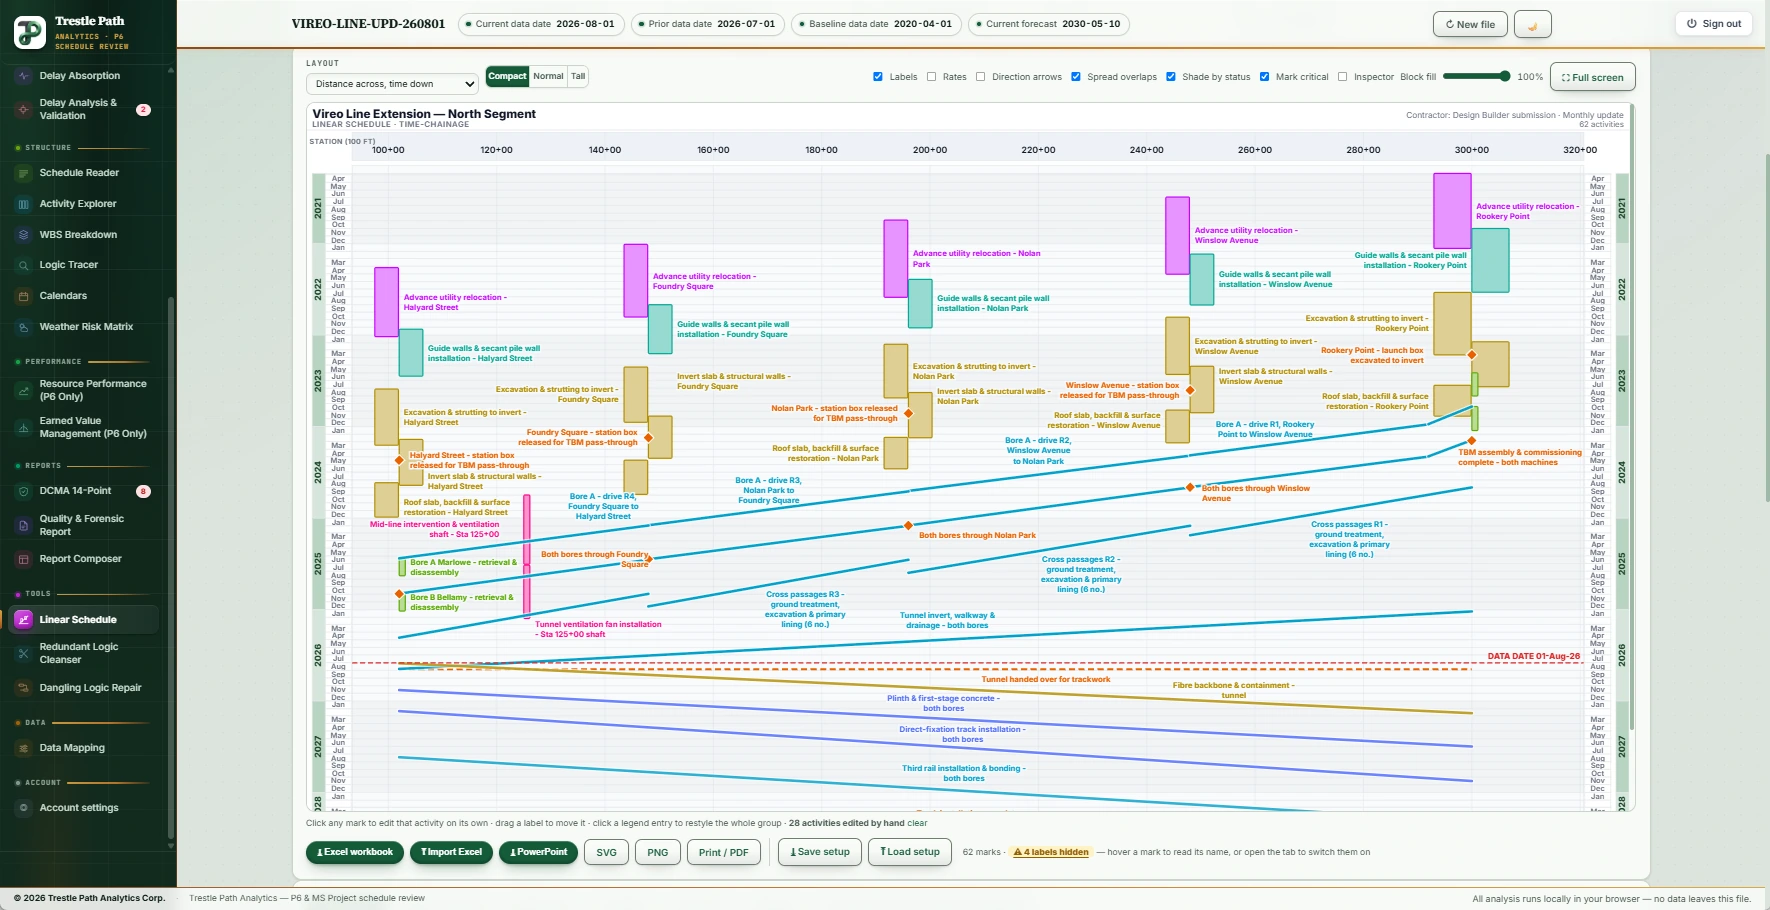 Drawings & reportsLinear Schedule
Screenshots show selected areas of each section; the descriptions cover the full capabilities.
When a forecast informs a decision, the calculation behind it matters. Repeated validation and transparent evidence are part of how we build Trestle Path — so you can examine the basis for the results you use.
Calculations are checked against known answers and real schedule files. Repeatable tests help catch discrepancies as the analysis evolves.
The critical-path network is analysed from activities and relationships. Re-scheduling works hour by hour on the schedule’s own calendars.
Follow findings to the underlying activities. Inspect the inputs and arithmetic, and carry the supporting evidence into your review and reports.
Review with confidence in how your file is handled, too. Your file is read in your browser and stays on your computer; the calculations run on our service, and nothing you send is stored.
Earned Schedule mathematics is tested with reference cases whose expected results can be calculated by hand.
Resource performance checks test that changing a chart from weeks to months does not change the position at the same comparison date.
Delay-analysis counts are checked against the underlying change records. Duration and calendar checks also cover supporting registers and workbook outputs.
See the result. Follow the evidence. Explore the calculations, source activities and reporting tools behind a thorough schedule review. Each screenshot shows part of a section; the descriptions explain its full capabilities.
24 analysis sections.Quality checks, change forensics, performance, reporting and XER repairs — every flag traced to the activities behind it.

Every number is worked out again from the activities and links underneath — nothing is copied from what the file claims about itself. Each result is shown with the sums behind it, checked against the DCMA, GAO, AACE and PMI standards. The P6 XER or MS Project XML is read inside your own browser and is never uploaded.
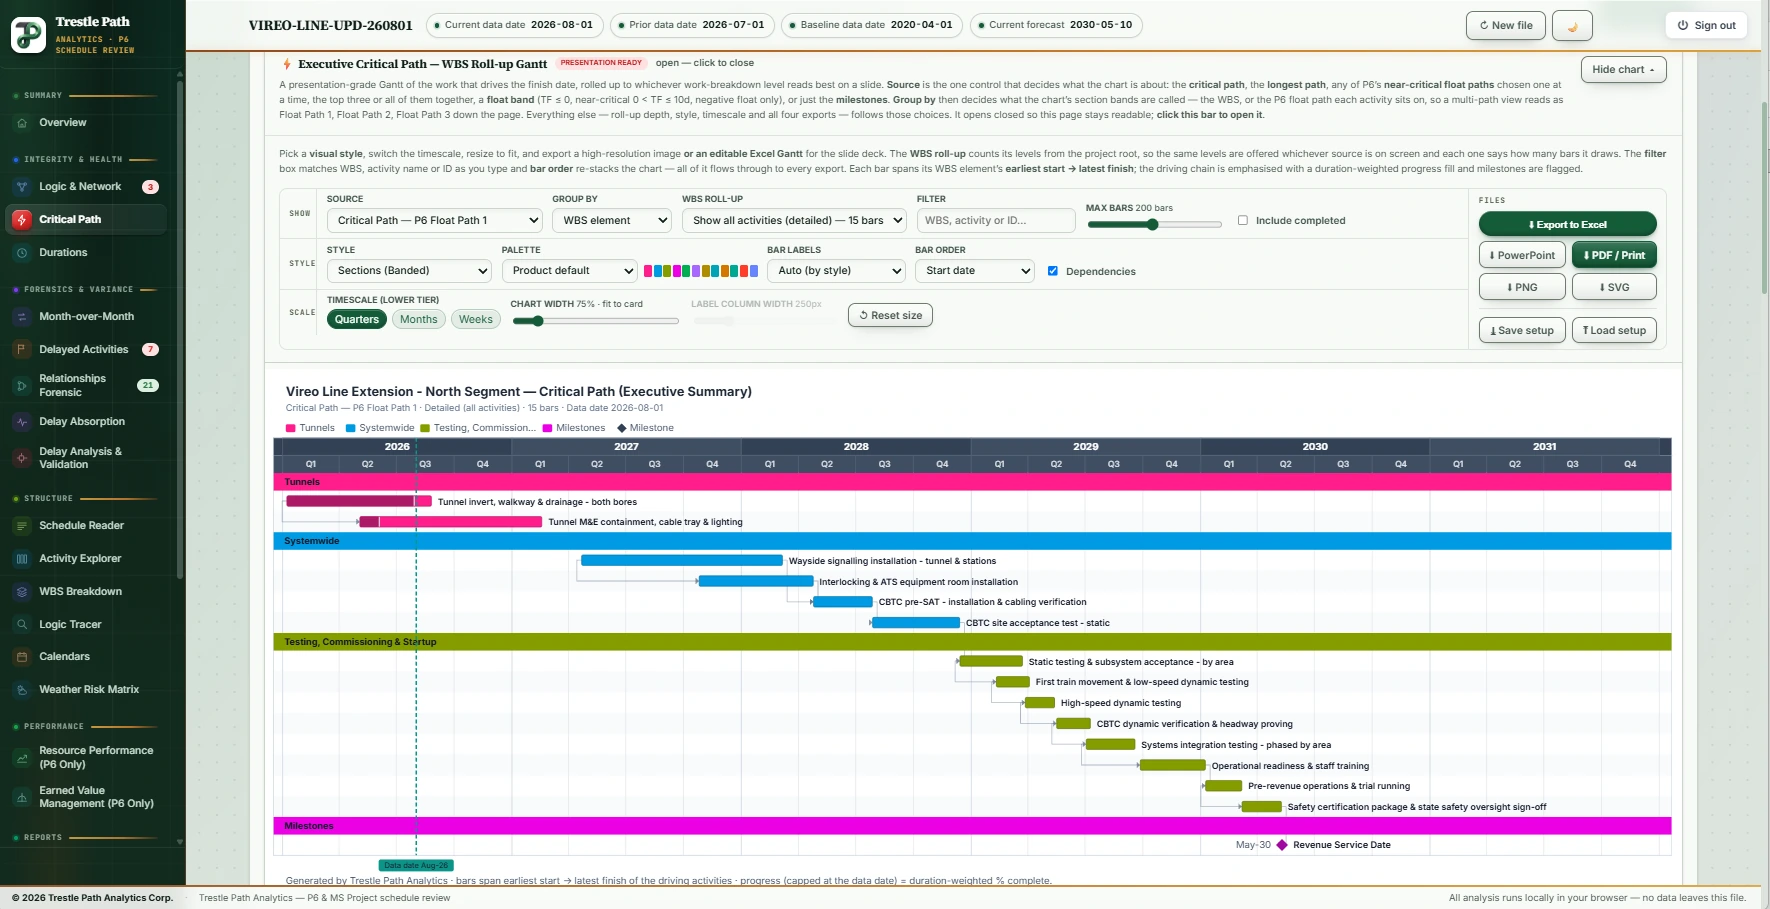
Recomputed from raw activities and relationships by the Longest Path method, with P6's Float Path 1 as the critical path — one consistent number on every page, chart and export. Continuity tested, near-critical bands exposed.
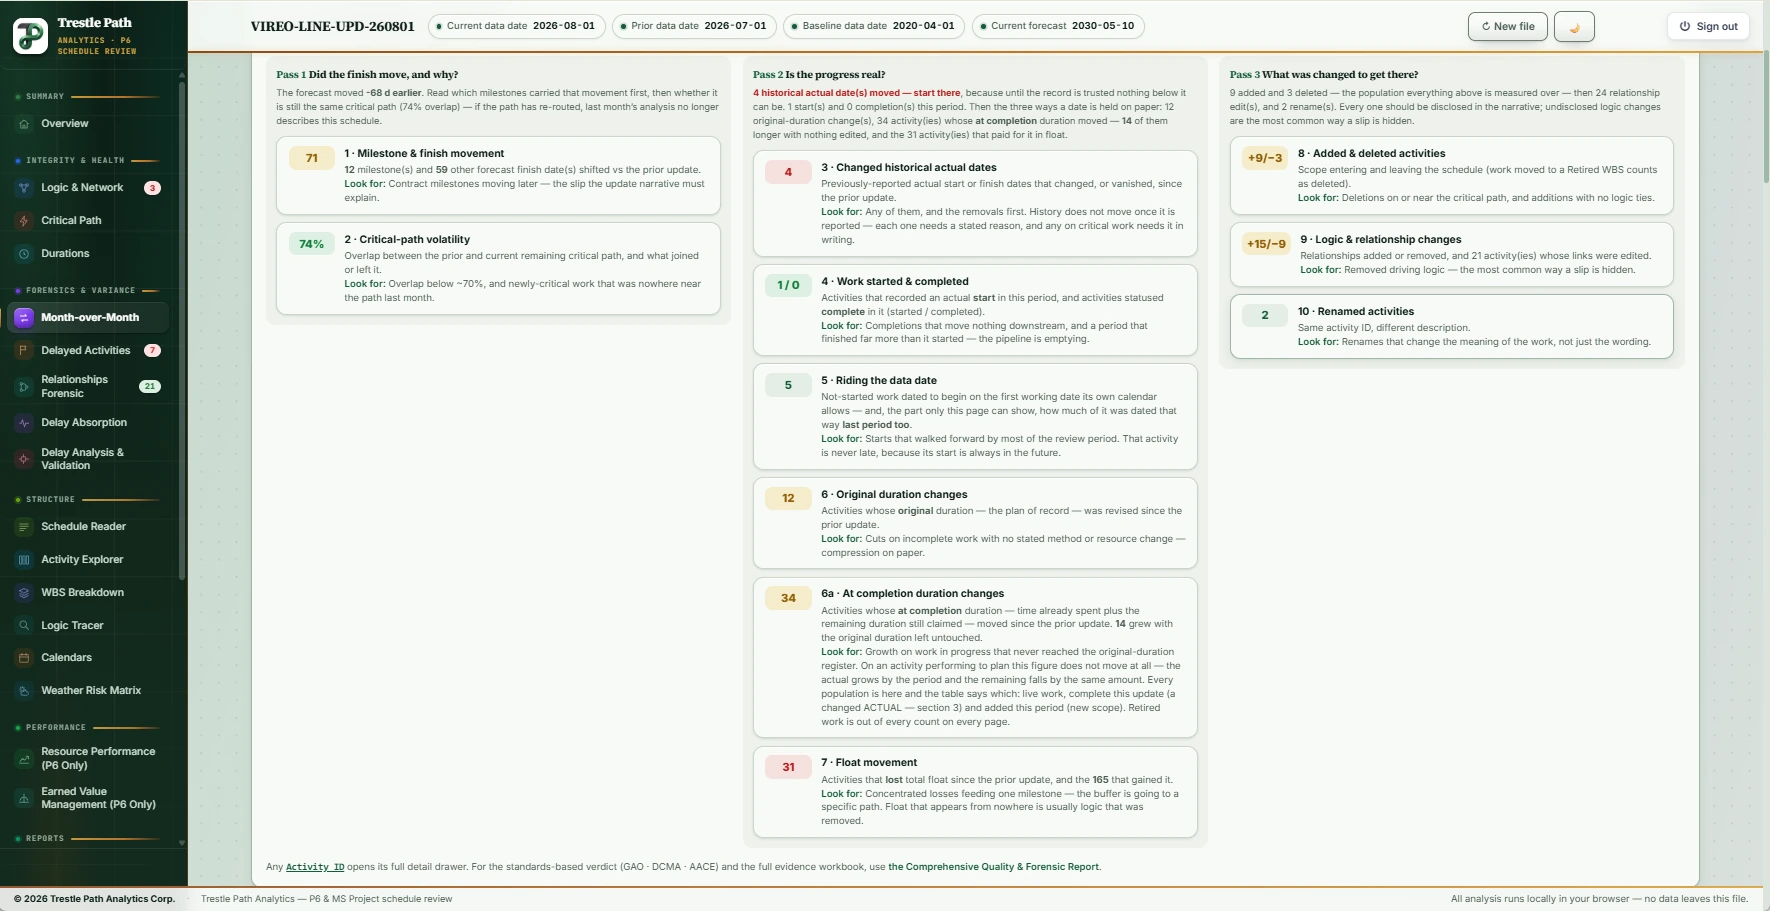
Load last month's update alongside this one and every edit surfaces: dates pulled without cause, logic added and removed, durations cut, calendars altered, float eroded — with the story of why completion moved.

Planned against actual units for any assigned resource — time-phased on the schedule's own calendars and P6 resource curves, and read at the exact data date rather than at the end of the month. Validated against a P6 Resource Usage Spreadsheet across 125 months. Pick several resources at once, summed or side by side. P6 XER · Baseline At Completion
A CPM schedule knows when, never where. Drawn from your own location coding, this shows what occupies which stretch of the alignment, when, and at what rate — with clashes and production rates visible. Editable on the page · Out as PowerPoint

Build the report this review needs: drag blocks onto a real page, resize and reorder them, and see the page breaks fall where they will actually fall. Thirty-eight blocks and four starting layouts — monthly review report, executive one-pager, claims pack, DCMA submission. PDF · Word · PowerPoint
All fourteen checks with adjustable thresholds, the arithmetic exposed beside each result, and a drill-down to the exact activities behind every number — plus the GAO four-characteristic scorecard.
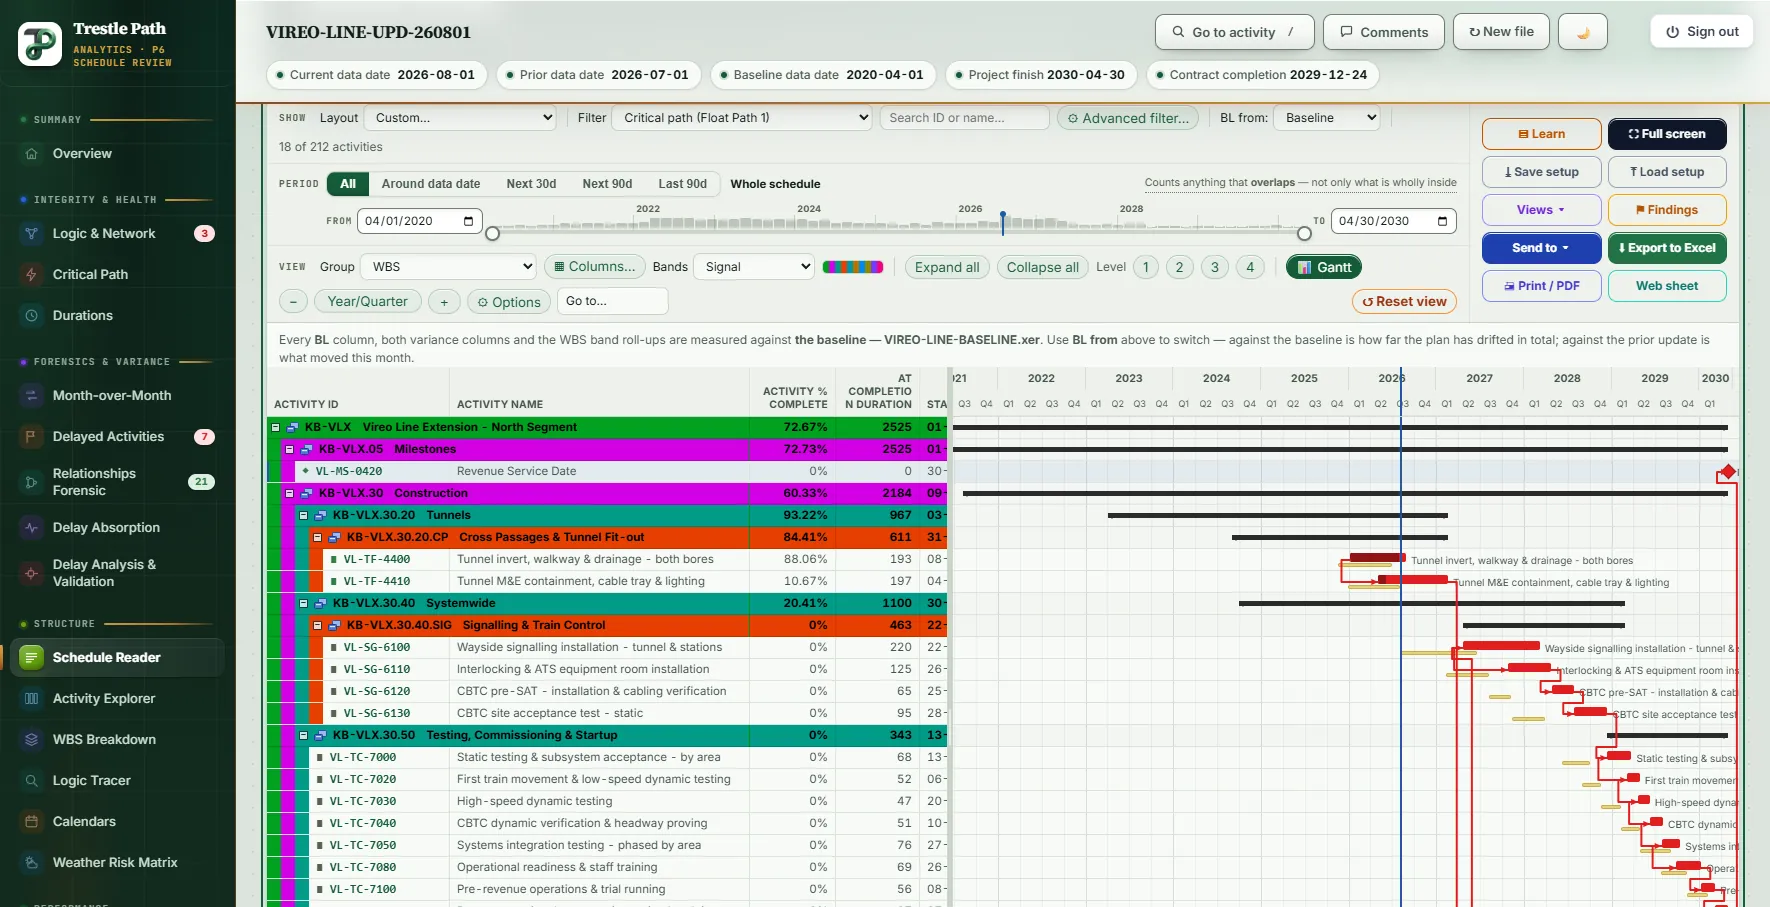
The whole schedule as P6 shows it: WBS bands with rolled-up values, a row-aligned Gantt with baseline and float bars, drag-and-drop columns, filters and full screen.
Test a delay fragnet against 52R-06 — how it is wired, and what it demonstrably costs when the network is re-scheduled without it. Or work back through a series of updates against 29R-03: what each period cost, and whether progress or re-planning caused it. AACE 52R-06 · AACE 29R-03

SPI drifts back to 1.00 as a job finishes, so it stops discriminating exactly when you need it. Nominate the resource your project governs as progress weight and the position is answered twice: SPI by volume, and Earned Schedule as a date and a number of calendar days — which does not drift. Nothing is inferred; the page will not choose the weight for you, and every input, formula and curve inversion is shown. P6 only · SPI · SPI(t) · SV(t)

Activities classified against a heavy-civil work-type library and plotted against regional climate normals, so work planned into the wrong season shows up before the season does.
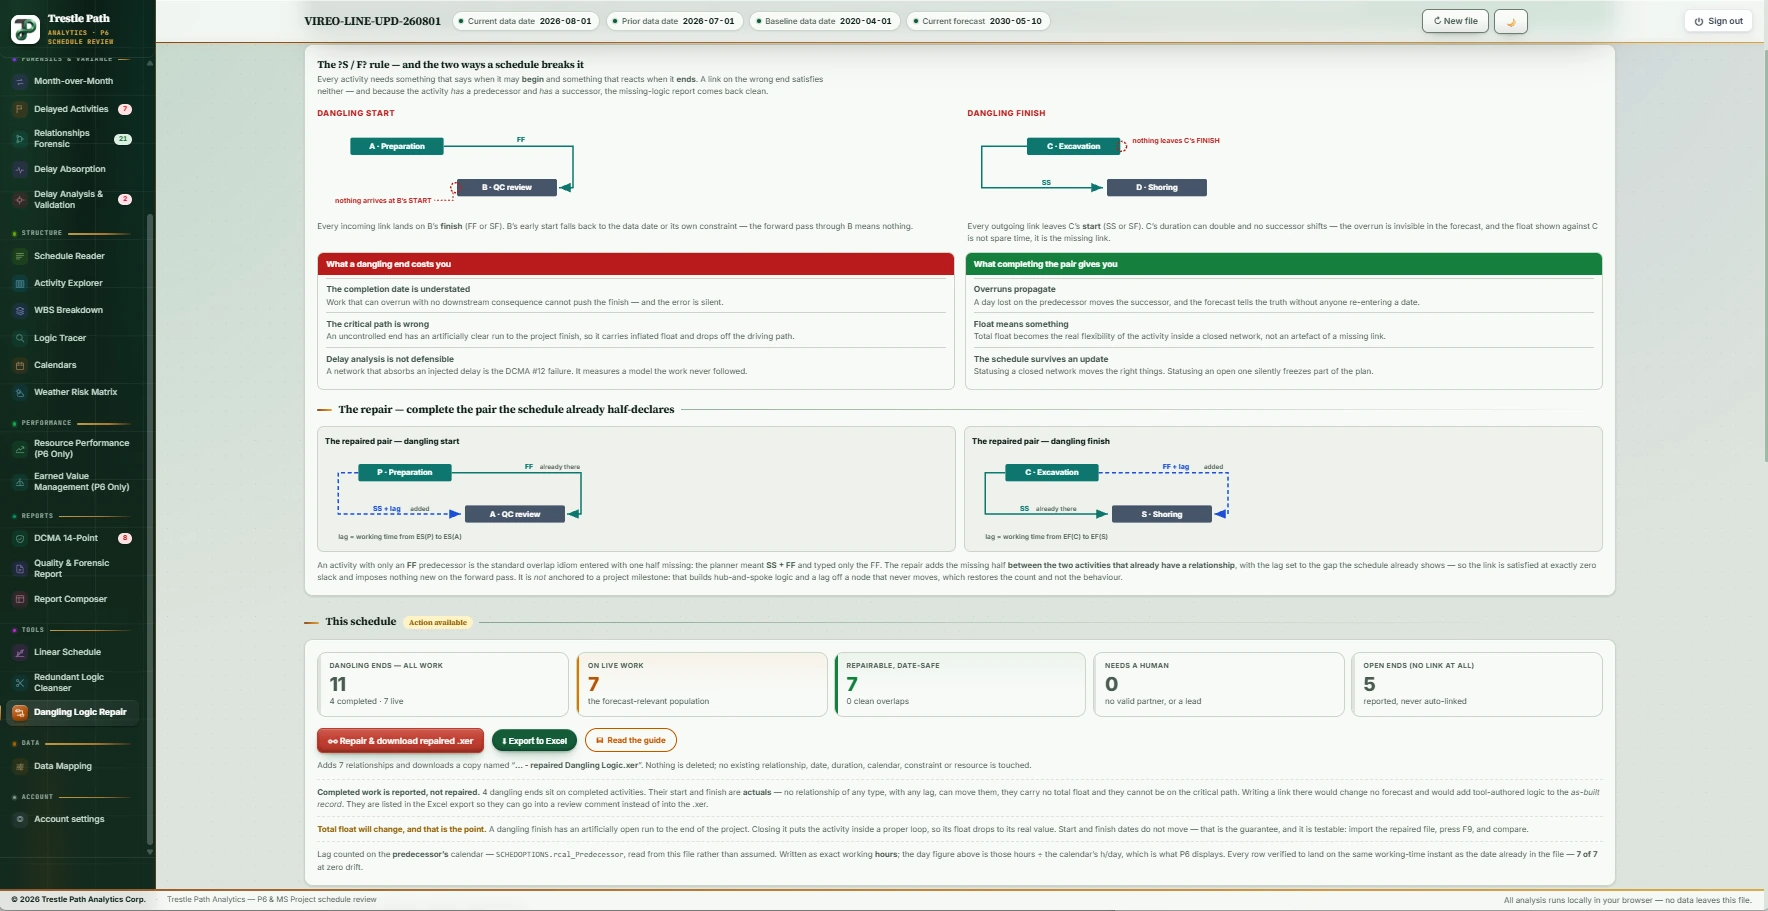
Activities whose start or finish no relationship controls — a start with only FF/SF arriving, a finish with only SS/SF leaving. Each one is closed by writing the half of the pair the schedule already half-declares, with a lag that makes the new link exactly non-binding, so no activity date moves — and you download the repaired XER. Sold with the cleanser as one module.

Progress, criticality and risk sliced by area of work with prior-period comparison, plus a searchable activity explorer with float-path and critical filters.

Long and zero-duration work, estimate heaping on round numbers, actual-versus-planned accuracy from finished work, and calendars checked shift by shift against their own hours-per-day setting.

Inject a what-if delay into any activity and watch the float network absorb it. An hour-true CPM re-schedule on the schedule's own calendars shows exactly how many days a milestone can soak up before its date moves.

Trace the driving chain behind any milestone hop by hop, see which relationships were rewired this period, and challenge a date with the exact link that produced it.

Trace the driving chain behind any milestone hop by hop, see which relationships were rewired this period, and challenge a date with the exact link that produced it.

Progress, criticality and risk sliced by area of work with prior-period comparison, plus a searchable activity explorer with float-path and critical filters.

Find and strip "leapfrog" links the network already enforces elsewhere — the ones inflating logic density and sequestering float. Every removal is verified non-driving, and you download a cleansed XER with a report of what went.

One click produces the whole review as an Excel workbook — every finding, every register, every changed relationship, each tab stating its purpose, the standard behind it and what to look for. Ten more styled exports sit behind the individual pages.

Open ends, dangling and isolated logic, leads and long lags, start-to-finish links, merge and burst points, duplicate relationships — the checks that decide whether the network means anything at all.

Long and zero-duration work, estimate heaping on round numbers, actual-versus-planned accuracy from finished work, and calendars checked shift by shift against their own hours-per-day setting.

The whole overdue backlog measured against the prior update, split into what fell due this period and what has been carried forward — including work quietly re-dated to "starting now" month after month.

The file’s audit trail: what it contained, what was carried into this review, what was held out of it and why — and the P6 settings that shape the answers on every other page.

Twenty-four analysis sections and a sixty-tab evidence workbook, from a Primavera P6 XER or a Microsoft Project XML. No installs, no file uploads, no IT approval — the file is read in a browser tab, the calculations run on our service, and the review is back in about a minute.
An MS Project file can hold eleven frozen baselines. All of them are read, with coverage and distance from the current plan stated — and the ones quietly re-set from today's schedule are flagged, because measuring against those makes every index read 1.00 for arithmetic reasons rather than performance ones.
No P6 licence needed to check a schedule. Load an XER or XML on a phone — look up an activity, read the findings, review a report — on site, in a meeting, anywhere.
The same analysis answers all of them. What changes is which side of the report you are on.
Twenty-four analysis sections and a sixty-tab evidence workbook, from a Primavera P6 XER or a Microsoft Project XML. No installs, no file uploads, no IT approval — the file is read in a browser tab, the calculations run on our service, and the review is back in about a minute.
The Primavera P6 XER or Microsoft Project XML you already have — one you built, or one you were sent. No special export, no add-in, nothing extra to ask for.
Add last month’s update alongside it — every plan can, and that file becomes your baseline. Parsing, the CPM re-schedule and the mapping all happen locally, in seconds.
Start at the Overview triage, then follow whichever flag matters. Inspect the supporting activities and arithmetic, so your review comments have evidence behind them.
Compose the report you need and export it as a PDF, an editable Word document or a PowerPoint deck, with the evidence workbook attached when a finding needs backing.
Bring a schedule you know. Inspect the findings, trace the calculations and compare the evidence with your own review. Create an account and the whole platform opens for two weeks — every section, every export, on your own live schedules. If it is not for you, do nothing and it lapses on its own. If it is, choose the plan that matches how you work. You change it, add a module to it or cancel it yourself, from inside the dashboard, whenever you like.
More than one reviewer is a conversation, not a form. We set the licences up against your people’s email addresses, on one invoice, whether that is two of you or fifty — and from ten seats it is an annual term with purchase orders accepted.
Email us and we will set the licences up for you — one invoice, activated against your people’s addresses, no per-person signup. There is no self-serve multi-seat checkout yet, so this is a short conversation rather than a form.
Annual term, purchase orders accepted, no credit card and no per-person signup. We activate each licence against your people’s email addresses and hand you the list.
Schedule files are read in your browser and never uploaded. The calculations run on our service from the numbers alone, which are never stored; your exports save straight to your own disk.
XER and MS Project XML files are never uploaded. Only the numbers a review needs go to the calculation service, held in memory while it calculates, then gone.
Sign-in stores who you are and whether your access is active — never project content.
Evaluating the platform for a program, stuck on an analysis, or just want to talk schedules — send a message and we'll come back to you.
One cookie keeps you signed in. Nothing here counts, profiles or follows you.
There is no analytics on this site, no advertising and no tracking. What we do use is a sign-in cookie and a Google bot check that keeps automated sign-ups and licence sharing off the service — both are needed to run it, so neither can be switched off. What each one does.
__session cookie, set only once you sign in, that lets our server
confirm you may open the tool. It carries nothing about your work.