
What the page answers
A monthly review keeps asking where: where the remaining work is, where the critical path runs, where the slip came from. The breakdown the contractor built answers all three, provided every figure is rolled up the same way at every level. Levels are numbered as P6 numbers them: the project is level 1.
Four tiles head the page.
| Tile | What it counts |
|---|---|
| WBS areas | The lowest-level areas of the breakdown, elements with no child element of their own, with the total number of WBS nodes beside it. |
| Carry critical path | Areas holding unfinished work on Float Path 1, the critical path this review derives, and their share of all areas. Past a third, the tile warns that recovery has no focal point. |
| Worst slip | The largest forward movement of any area's finish: against the prior update when one is loaded, otherwise against the baseline. Working days first, calendar days beside them. |
| Behind plan | Areas whose duration-weighted activity per cent complete trails the elapsed share of their activities' own baseline windows by more than 15 points: an indicator, not earned value. Without a baseline, areas holding negative float. |
A switch above the tiles reads the current update, the prior update or the baseline through the same page, so last month's breakdown can be read as it stood.
How an area rolls up
Every column is computed from the activities beneath an area, the same way at every level.
| Column | How it rolls up |
|---|---|
| Acts | Activities beneath the area, with the number still to finish. Level-of-effort activities are counted beside them ("3 LOE") and never enter a date, float or activity count. |
| Progress | Weighted by the resource you nominate (see below); blank until you choose one. |
| Status | Complete, in progress and not started, as a stacked bar. |
| Start, Finish | The earliest start and the latest finish beneath the area, actual dates included. |
| Baseline · Slip | The area's baseline finish, then how far its finish has moved from it. |
| Δ update | How far the area's controlling finish moved since the prior update. |
| Min TF | The lowest total float among its unfinished activities, banded at 0, 10, 20 and 44 days. |
| Crit · Near · Neg | Unfinished activities on Float Path 1, with total float of 10 days or less, and with negative float. |
| Rem work | Remaining duration summed over the unfinished activities, in working days: where the undone work is. |
| Health & flags | A score out of 100 and the flags that lowered it. Click them for what each means; the magnifier lists the area's activities. |
Three rules make the slip figures safe to quote.
- Comparable work only. Movement since the prior update is measured over the activities present in both files, matched by ID, so added or deleted scope cannot pass for slip. Areas are matched to last month's by WBS code path and name path; where both are found and disagree, the area is reported unmatched rather than paired wrongly.
- The driving activity's own calendar. A slip is the movement of one date, the area's controlling finish, so it is counted in working days on the calendar of the activity carrying that finish, holidays included, with calendar days beside it. Neither figure should be quoted without the other.
- Contradictory status is set aside. An activity in progress at 100 per cent with no actual finish has a forecast that cannot be trusted. It stays out of the slip figures, and the slippage view says whether that changed any of them.
The health score starts at 100 and loses points for low or negative float, a high share of critical work, slip against the baseline beyond 5, 10 and 20 working days or since last month beyond 5 and 10, hard constraints or open ends on more than 5 per cent of the remaining activities, progress 15 points behind plan, float lost faster than the calendar, and contradictory status. Bands run from Healthy (80 and over) to Critical (under 24).
Five views of the same breakdown
| View | What it shows | Controls |
|---|---|---|
| Table | The tree with every column above, a numbered level badge and a coloured band per level. | Expand, collapse, a chip per level, sort, level palette, full screen |
| Treemap | One tile per area at the chosen depth, up to 80, sized by remaining work or activity count. | Depth; colour by health, minimum float or slip |
| Timeline | One bar per area from earliest start to latest finish, up to 90, with the baseline as a grey bar beneath and last month's forecast as a thin violet bar. | Level, current or prior bars, sort |
| Slippage | Each area's finish movement as a bar either side of zero on a working-day axis, up to 60 areas, with the driving activity, float and activities added or removed. | Last update or baseline, level, order |
| WBS Graph | The WBS roll-up Gantt, described below. | Scope, roll-up level, WBS elements, style, markers, timescale |
The search box narrows every view by WBS name or code. The charts export as an editable PowerPoint slide, PNG, SVG or a print page. Export to Excel writes a 13-sheet reviewer's workbook: a cover, the breakdown, a level roll-up, work packages, criticality and float, slippage, status and units, constraints and open ends, weighted progress, a health scorecard, activities by WBS, data integrity and the method.
A monthly pass:
- Load the update, last month's update and the baseline; run the review and open WBS Breakdown.
- Open Slippage against the last update at the lowest level, then at the level you report at.
- Nominate the progress weight resource and read the coverage sentence before quoting a percentage.
- Open the flags on the lowest-scoring areas, then export the workbook or a chart.
Progress weighted by a resource, never by duration
Averaging per cent complete up a breakdown is the commonest way to overstate progress. Weighted by duration, a 60-day allowance and a 60-day bridge deck count the same, and Activity % Complete measures something different on every activity, depending on its percent complete type. The page uses neither.
You nominate the resource whose budgeted units carry each activity's agreed weight, usually a value or progress resource the contract defines. Each area's progress is then the sum of budgeted units times per cent complete, divided by the sum of budgeted units, over every activity beneath it. It is never an average of the children's percentages: an 80-weight activity at 25 per cent beside a 20-weight activity at 100 per cent is 40 per cent, not 62.5.
- Two bases, both P6's own. Units % Complete (the default) and Physical % Complete, as exported. Duration % Complete is not offered.
- The choice stays yours. The picker groups resources by P6 type and marks the one with the widest activity coverage, but never chooses: which resource carries the agreed weight is a contractual fact.
- Gaps are counted, not filled. An activity without the resource stays out of the arithmetic and is counted. An activity with it but no progress value keeps its weight and earns nothing. Below 90 per cent coverage the figure carries a warning mark.
- Level of effort enters only where the nominated resource is assigned to it with a positive budget, and the sentence under the controls says how much weight it carries.
- No fallback. With no resource chosen the column reads "select resource", and the workbook reports no progress at all rather than a duration-weighted average.
Click a percentage for the area's budgeted and earned weight and its share of its parent's and the project's weight.
The WBS roll-up Gantt, drawn as P6 draws it
The WBS Graph draws the breakdown the way P6 does under Group and Sort by WBS. Every band from the project down to the level you choose gets a summary bar, in the WBS's own sibling order: sequence number, then the order the elements were created. A band spans the earliest start and latest finish of every activity beneath it, actual dates included. Show activities lists the work under each band, as P6 does with Show Summaries Only cleared, and an element with nothing in scope is not drawn, as with Hide if empty.
- Scope chooses the work rolled up: the whole breakdown, or only the work on Float Path 1, on the longest path, at or below zero or ten days of total float, with negative float, milestones, work in progress or remaining work. Level-of-effort activities count for a band's dates, as in P6, but never for its float or its critical colour.
- WBS elements narrows the chart to the branches you tick, each to its own depth; their parents stay as bands rolled up over the ticked work only. The choice is kept by element ID and by name path, so it finds its element again in an update whose WBS IDs were re-issued.
- Markers draw the data date, the contract completion, the project finish and your own dated lines. Bars can carry dates, duration, per cent complete or finish against the baseline, with baseline bars beneath. Drag a label to move it; click a band to fold or hide it.
- Style and output. Four styles, a palette, label depth, bar order, a quarter, month or week timescale and adjustable widths. Exports: an editable Excel Gantt, an editable PowerPoint slide, PDF, PNG and SVG. Save setup carries every choice to next month's file.
Worked example: a metro extension's August update
The Vireo Line Extension is a fictional twin-bore metro extension with five underground stations, supplied with the product as a demonstration set; nothing in it is real. Its August 2026 update (data date 2026-08-01) was read with the July update as the prior and the 2020 baseline. The breakdown has 27 WBS nodes in four levels over 207 activities, 77 unfinished, and 3 level-of-effort activities. The tile counts 22 lowest-level areas, two of which hold no ordinary work: the level-of-effort area and a retired-scope area.
Where the critical path lives
Five areas, 23 per cent of them, carry the 18 activities of Float Path 1: Testing, Commissioning & Startup (8), Signalling & Train Control (4), Delay Events (3), Cross Passages & Tunnel Fit-out (2) and Milestones (1). With Scope set to the critical path and every level drawn, the WBS Graph puts the same 18 activities in nine bands. No area holds negative float. Drawn whole, at all levels, the roll-up Gantt has 26 bands (1, 8, 5 and 12 at levels 1 to 4); the retired-scope element holds nothing in scope and is not drawn.
What moved since July
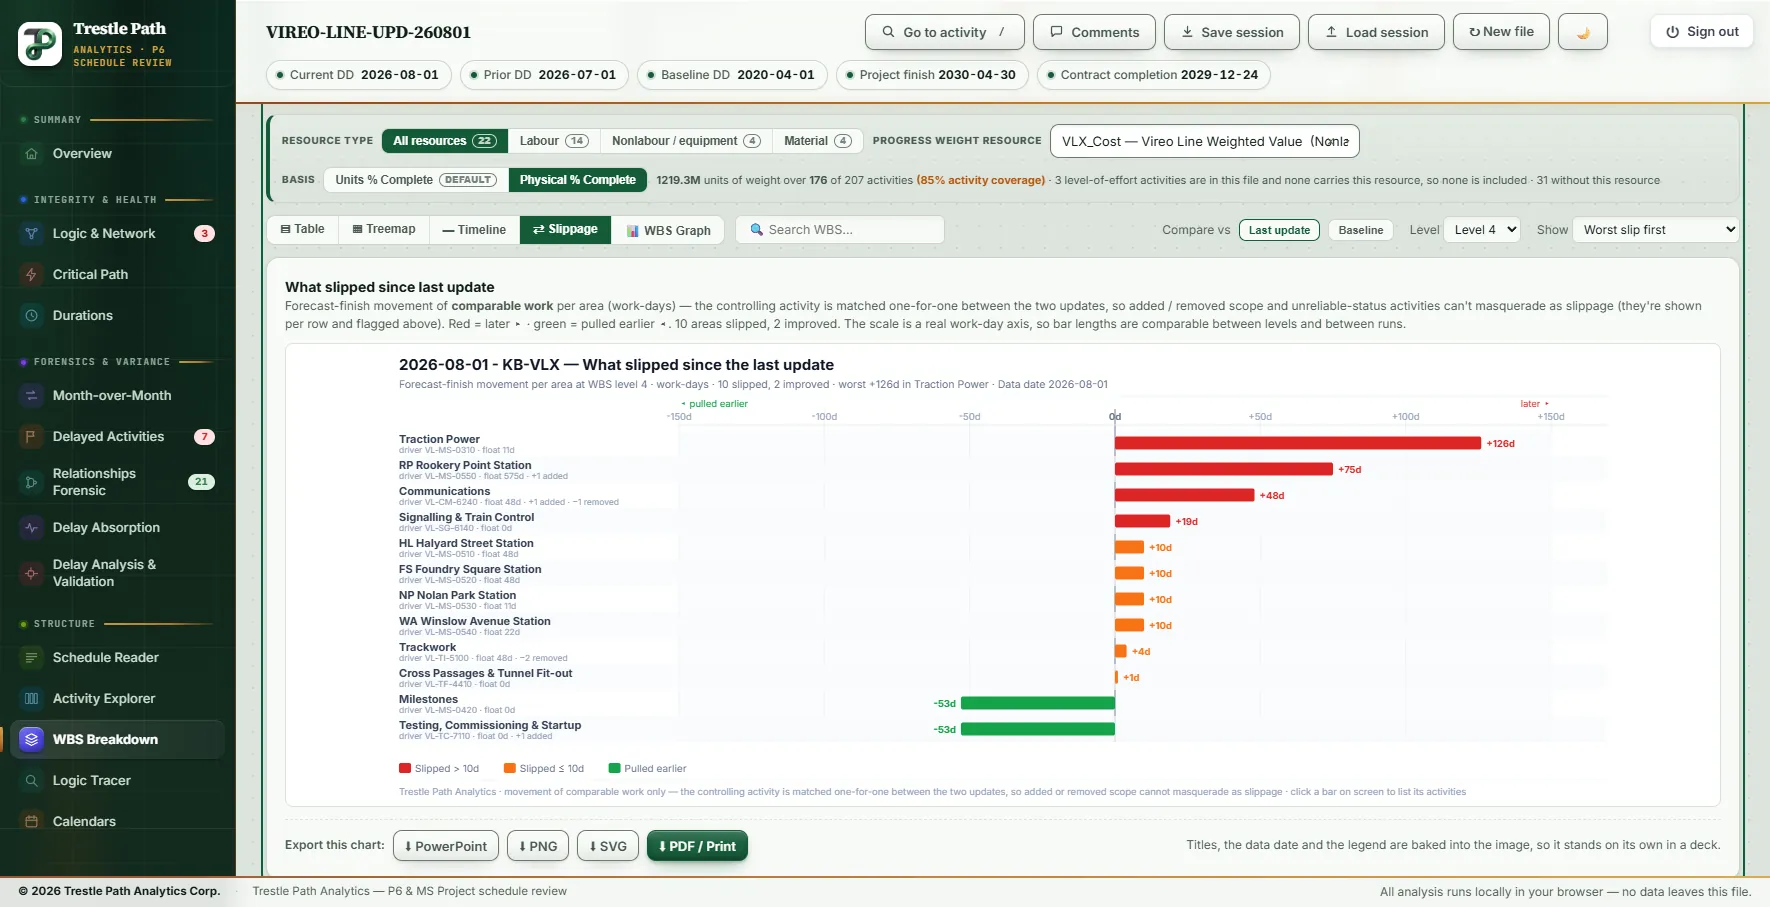
At level 4, against July, ten areas slipped and two came earlier. Traction Power moved furthest: +126 working days, 187 calendar days, driven by VL-MS-0310, Traction power energized - full line, now 2028-11-29 against 2028-05-26 in July. Rookery Point Station moved +75, Communications +48, Signalling & Train Control +19 and the other four stations +10 each. Milestones and Testing, Commissioning & Startup came 53 working days earlier, 78 calendar days.
Read the same chart at level 3 and Traction Power disappears: Systemwide shows +19, because its controlling finish is the signalling cutover, which finishes after the traction power work. A slip of 187 calendar days inside a branch that does not control its parent is invisible one level up, so read slippage at the lowest level first.
Signalling & Train Control shows why both units are printed. Its controlling activity, VL-SG-6140, Signalling cutover to the operating line, sits on a weekend possession calendar that works two days a week: +19 working days this month is 64 calendar days, and +73 working days against the baseline is 259. The area scores 30 out of 100, At risk: its float is zero, four of its five activities are on the critical path, and both slip flags are raised.
Progress by weight
The file carries 22 resources. The one with the widest coverage is VLX_Cost, Vireo Line Weighted Value, a non-labour resource on 176 of the 207 activities (85 per cent coverage) with 1,219.3 million units of budget. On the default Units % Complete basis every area reads 0.00 per cent with a warning, because the file carries no Units % at all; the page will not invent one. On Physical % Complete the project is 74.50 per cent complete by weight. Tunnels reads 99.45 per cent and carries 37.2 per cent of the project's weight; Stations reads 69.42 per cent and Systemwide 14.06 per cent. Milestones and Delay Events read N/A: no weight sits on them.
Two areas are behind plan, Cross Passages & Tunnel Fit-out and Communications, each 16 points behind the elapsed share of their baseline windows.
Limits
- It rolls up; it does not reschedule. Dates, float and remaining durations are the file's own; the critical path is this review's Float Path 1.
- Behind plan is an indicator. It compares duration-weighted activity per cent complete with elapsed baseline time; it is not earned value.
- Health is a screen. Its thresholds (the 5 per cent screens, the 10- and 20-day float steps, the 15-point line) follow common practice, not a rule in any standard.
- Weighted progress needs a weight. Without a resource that carries the agreed weight the page shows none. Physical % Complete is read as exported; activity steps are not recalculated.
- Retired scope stays out. Activities under a WBS named Retired, Inactive or Deleted are left out here, as on every analytical page; the Schedule Reader lists them.
- Microsoft Project XML. The summary tasks are the breakdown, keyed by their WBS code or outline number, and the prior update and baseline must be Project files too.
Where to find it
The WBS Breakdown, with its WBS roll-up Gantt, is included in every plan, from Reader up, and in the fourteen-day trial. Current prices are on the pricing page. To read the same activities inside their WBS bands with a P6-style Gantt and the columns you choose, see the Schedule Reader; for how Float Path 1 differs from the longest path and a total-float filter, see critical path, longest path and float paths.
Fourteen days free
Try it on your own schedule
Fourteen days free, no credit card, every section open. Your XER or XML file is read in your browser and never uploaded; only anonymous numbers reach the calculation service, and nothing is stored.
RelatedThe Schedule ReaderCritical path, longest path and float paths