
The Explorer and the Schedule Reader
Both read the same activities. They answer different questions, and a set found on one can be sent to the other.
| Schedule Reader | Activity Explorer | |
|---|---|---|
| Shape | The schedule in its WBS structure, with a Gantt chart | A flat list, sorted however you like |
| Best at | Reading the plan, following logic on the chart, printing a sheet, raising review comments | Counting and finding: which activities, how many, and what they share |
| Scope | The whole file, including retired WBS branches | The live schedule the analysis pages read |
| Other files | The baseline columns compare against the baseline or the prior update | The whole page can be read on the current file, the prior update or the baseline |
| Unique to it | Bands with roll-ups, the chart, the A3 sheet and the web sheet | The tiles, number expressions in every column, group totals, the assignments views |
Five ways to narrow the list, and they stack
- The tiles. All activities; under Criticality: Critical (the critical path, Float Path 1), Zero float, Negative float, Near-critical (more than zero and up to ten days) and Float path 2-3; under Progress: In progress, Not started, Complete; under Attributes: Constrained, Milestones, LOE / summary. One click scopes the list, a second click on the same tile clears it, and every tile's count is measured against whatever else is filtering, so the row of numbers describes the set you are looking at.
- The search box. It matches the ID, the name and the WBS path, and also every activity-code value, every user-defined field and the notebook text.
- A box under every column. Text boxes match "contains". Number boxes take expressions (below). Status, type, constraint, calendar, critical and every activity code offer a list of the values actually in the schedule.
- The period. Around data date, Next 30d, Next 90d, Last 90d or any window on the slider; anything whose work overlaps the window is listed, including work already under way.
- Advanced filter… Any column, with all or any, operators by field type, and a live count as the criteria are built.
| Type in a number box | Lists |
|---|---|
| >30 | more than 30 |
| <-10 | less than −10, for example ten days late against the baseline |
| >=0 | zero or more |
| 30..90 | between 30 and 90 |
| =1 | exactly 1. Without an operator a number box matches as text, so 1 would also find 10 and 12 |
The line above the table says what is in force: the period, the tile ("Scope"), the advanced filter, a set sent from another page, and "Showing N of N matching". clear filters clears the boxes, the search, the tile and the criteria; clear period clears the window.
What most people never find
| Capability | Where it is | What it is for |
|---|---|---|
| Last month's list, and the baseline's | Current / Prior / Baseline | The whole page re-runs on the other file, with your tile, boxes, sort and period carried across: the same question asked of last month |
| The driving chain as a filter | The activity drawer: Filter the Explorer to this activity's driving chain | Lists what drives an activity and what it drives, in date order. Switch to Prior or Baseline and the chain is traced again on that file |
| Open ends by sorting | The Predecessors and Successors columns | They sort by how many links an activity has, so ascending puts the open ends first |
| Groups with totals | Group | By WBS, any activity code, calendar, status, float band, resource, type, constraint or month; each band totals the durations (Σ), weights the per cent complete and gives the lowest float |
| Who is on the work | Assignments, then List or By month | One row per resource assignment on the activities listed, with budgeted, actual, remaining and at completion; or units by month for each resource, totalled by type, never across types |
| Seven layouts | Layout | Classic, Progress / Update, Baseline / Variance, Critical / Float, Constraints, Logic / Open Ends, Durations |
| Review columns | Columns… | Claim gap, Expected Finish, Calendar h/day mismatches, Secondary Constraint, Float Path, Longest Path, the Notebook, every activity code and user field |
| Every table in the drawer travels | The activity drawer | The predecessor and successor tables carry their own Excel, CSV and Copy buttons, and say which link drives and by how much the others miss |
| The list, elsewhere | Send to | To the Schedule Reader in its WBS structure, to the Linear Schedule, the first row to the Logic Tracer, the IDs one per line, or the table as tab-separated text for a spreadsheet |
| The same view next month | Save setup, Load setup, Reset view | Columns, boxes, tile, period, group and criteria in one file. A preset period is recalculated from the new file's data date, so "Next 90d" stays the next 90 days |
| The whole review, kept | Save session, Load session (top bar) | This page with every other page and the comment log in one file on your computer; load it onto the same schedules another day and the review is as you left it |
Recipes
Each recipe is a question a reviewer asks of an update or a baseline; the checks follow AACE 53R-06 for updates and AACE 78R-13 for baselines. Counts on your screen come from your own file.
1. What critical and near-critical work starts in the next quarter?
- Press Next 90d in the Period row. The tiles recount to the window.
- Click Critical, or Near-critical; or type <=20 in the Total Float box for a band of your own.
- Set Group to Month it starts for a lookahead by month, then Export to Excel.
2. Which constraints are there, and are they doing anything?
- Click Constrained and choose the Constraints layout: type, date, float, start and finish side by side.
- The tile counts primary constraints. An activity can be held by a secondary constraint with the primary blank, so clear the tile and use Advanced filter…: Secondary Constraint is not empty.
- Compare each constraint date with the activity's dates. A constraint on critical work that is not holding a date today will hold one as soon as the work ahead of it recovers; each needs a reason in the narrative.
3. Where are the open ends?
- Choose the Logic / Open Ends layout.
- Click the Predecessors title, then Successors: they sort by how many links an activity has, fewest first. The project's own start and finish milestones are expected at the top; anything else is a question.
4. Long durations and high float
- Choose the Durations layout and type >44 in the Orig Dur box. Then choose Critical / Float and type >44 in the Total Float box.
- Forty-four working days is the common DCMA convention, not a rule. Long activities hide progress, and high float often means missing successors; read both against the project's own detail.
5. Progress claims worth a question
- Click In progress and choose the Progress / Update layout.
- Add Claim gap (physical per cent minus duration per cent; red beyond 15 points either way) and Expected Finish, which makes P6 back-calculate remaining duration.
- Type >15 in the Claim gap box: progress claimed well ahead of the time burnt.
6. What drives this milestone, and what drove it last month?
- Click the milestone's ID (or double-click its row) and press Filter the Explorer to this activity's driving chain. The list becomes the chain, in date order, under a "Driving chain of …" pill.
- Switch to Prior: the same chain on last month's file. Then Baseline. Activities that joined or left the chain are the story of the month.
7. Who is on the work, month by month?
- Set the period, for example Next 90d, and any tile or filter.
- Press Assignments, then By month: each resource's units for each month of the window, with Earlier and Later columns and a subtotal for each resource type.
- Narrow with Every resource type, Resource contains… or Activity contains…, then Export to Excel.
8. Did last month's numbers change?
- Press Assignments, then List, and type the activity in Activity contains….
- Read Actual, Remaining and At completion, then switch to Prior. Actual units should only grow; when they fall, previously reported progress was changed, and AACE 53R-06 asks for the reason in writing.
Worked example: a metro extension's August update
The Vireo Line Extension is a fictional twin-bore metro extension supplied with the product as a demonstration set; nothing in it is real. Its August 2026 update was read with July as the prior and the 2020 baseline.
The tiles
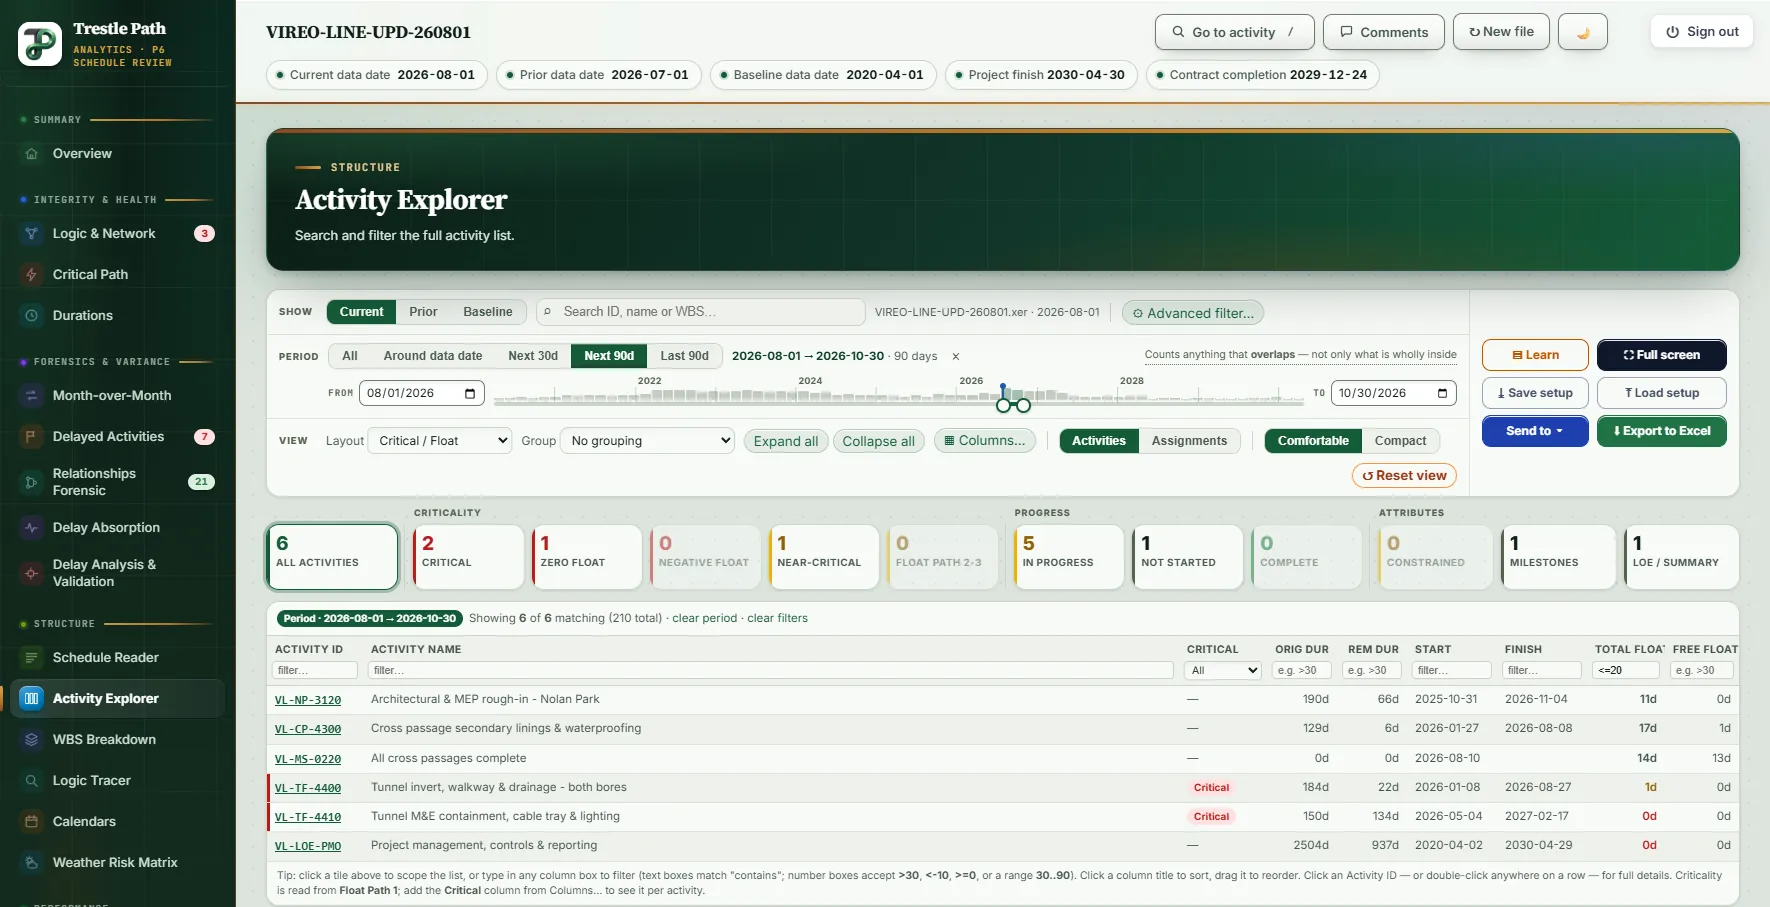
The live schedule has 210 activities (two more sit in a retired WBS, which the Schedule Reader shows and the Explorer leaves out). The tiles read 18 critical, 9 at zero float, none negative, 12 near-critical and 6 on float paths 2 and 3; 15 in progress, 63 not started and 132 complete; 5 constrained, 25 milestones and 3 level-of-effort. Pressing Next 90d recounts them to the 29 activities at work between 1 August and 30 October: 2 critical, 15 in progress, 14 not started. Typing <=20 in the Total Float box leaves six, the work most likely to decide the next quarter.
The chain into Revenue Service Date
Traced from the Revenue Service Date milestone, the driving chain holds 18 activities in August. On the July file it held 15; the three that joined are the activities of a new delay event, Impact 11. On the baseline it held 41, running back through design, the tunnel drives, trackwork and communications. The chain today runs through tunnel fit-out, signalling and the testing sequence instead. That one comparison, three clicks, is the summary of how the project's critical path has moved since it was planned.
Constraints on critical work
Five activities are constrained. Two of them, Operational readiness & staff training and Pre-revenue operations & trial running, are on the critical path with Start On or After constraints dated April and July 2029, while the work is forecast to start in September 2029 and January 2030. Neither constraint holds a date today; both would, if the testing sequence recovered time. That is a question for the narrative, not yet a finding.
Hours that went down
The assignments of the cross-passage linings (VL-CP-4300) tell a story the dates do not. In July the Tunnel Crew had booked 31,200 hours, its whole budget, with 1,680 to go: 32,880 at completion. In August the actual reads 26,304 hours and the remaining 4,896, so at completion is back on the budget exactly. Previously reported hours were reduced, and the question to ask is why.
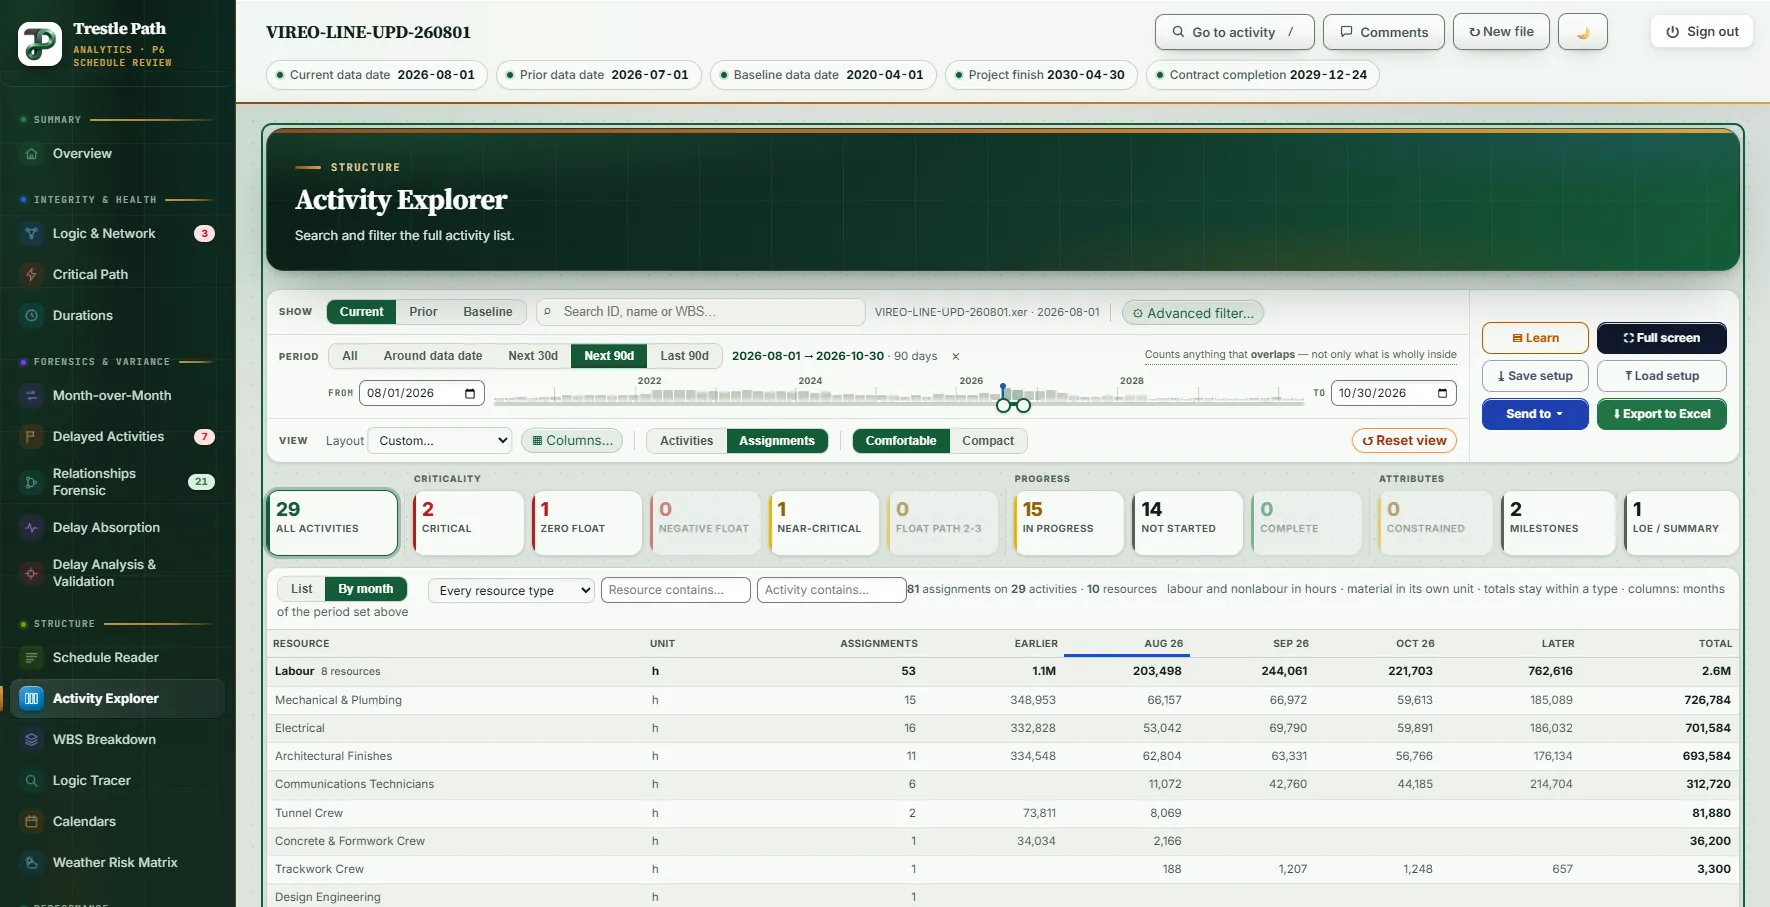
For the next 90 days the same activities carry 81 assignments across ten resources. The eight labour resources hold about 203,000 hours in August, 244,000 in September and 222,000 in October, spread evenly over each assignment's dates.
Keyboard
| Key | What it does |
|---|---|
| Ctrl+K or / | Go to any activity by ID or part of its name |
| Esc | Clear the search box, close the drawer, then leave full screen |
| Arrows, Shift, Home, End | Move a period handle a day, 30 days, or to either end |
Click a column title to sort (numbers and dates start with the largest), drag it to move the column, drag its edge to resize it. Click an Activity ID, or double-click anywhere on a row, for the drawer.
Limits
- It reads, it never edits. Findings raised from the drawer go to the comment log, which lives with the Schedule Reader.
- The baseline columns follow the Schedule Reader. BL Start, BL Finish and both variances compare against whatever the Reader's BL from is set to; they are hidden while the page reads the prior or the baseline itself.
- By month is an even spread of each assignment over its dates, for a quick view of who is on the work. The curve P6 itself draws, by period, is Resource Performance's job.
- Near-critical is ten days and the long and high-float thresholds are 44 days: conventions, not standards.
- Copy the table takes up to 5,000 activities; the Excel export has no limit.
- Microsoft Project XML carries no resource assignments, activity codes or notebook; the Unique ID is the key, with Project's row number beside it, and search finds either.
Where to find it
The Activity Explorer is included in every plan, from Reader up, and in the fourteen-day trial. Current prices are on the pricing page. For the same activities in their WBS structure with a Gantt chart, see the Schedule Reader; for everything that changed between two updates, see how to compare two P6 updates. The section's own guide, under Learn in the product, covers every control.
Fourteen days free
Try it on your own schedule
Fourteen days free, no credit card, every section open. Your XER or XML file is read in your browser and never uploaded; only anonymous numbers reach the calculation service, and nothing is stored.
RelatedThe Schedule ReaderHow to compare two P6 updatesDCMA 14-point assessment