
What a linear schedule shows that a bar chart cannot
Open any CPM schedule and you can answer "when does the deck pour happen?" in a second. Now try "on the day the paving train reaches chainage 4+200, what else is standing on that stretch of road?" Nothing in the file can tell you: the schedule has dates and logic, and no idea that two activities are in the same place. Two crews cannot occupy the same chainage at the same time; a tunnel boring machine cannot pass a station box that has not been excavated; a paving train that has to leapfrog three bridges has a sequence a bar chart cannot show.
The time-chainage drawing fixes that with one change: distance on one axis, time on the other. Everything else follows. The slope of a travelling activity is its rate, the direction of the slope is the direction of the work, and two marks that overlap on both axes are two crews in one place at one time.
Five marks and one rule
| Mark | What it is | Example on a metro extension |
|---|---|---|
| Line | Work that travels along the alignment; its slope is the production rate | A tunnel drive, a cross-passage campaign, trackwork, the systems fronts |
| Block | Work that occupies a range of chainage over a period | A station box, an advance utility relocation |
| Bar | Work at one location | The launch shaft, the retrieval shaft, a mid-line intervention shaft |
| Milestone | A point event, drawn as a diamond | A station box release, a breakthrough |
| Tie | A point event that applies across a range, drawn as a dashed rule | Tunnel handover, track completion, substantial completion across the whole alignment |
The one rule: direction is the sign of finish chainage minus start chainage. A drive coded 300+00 to 102+00 runs down-chainage and slopes that way; swap the two numbers and the drawing lies. It is the check most worth doing first.
The four fields to code in the schedule
In P6: Enterprise › User Defined Fields › Activities. The names are suggestions; the tool finds them whatever they are called. In Microsoft Project the equivalent is a custom field (Number1, Number2, Text1) with an alias.
| Field | Type | What goes in it |
|---|---|---|
| Start chainage | Number | Where the activity starts working. Use a number, not text: a text field sorts 1000 before 999 and breaks arithmetic. |
| Finish chainage | Number | Where it finishes. May be smaller than the start; that is how direction is recorded. |
| Style code | Text | One value per legend entry (fifteen to thirty is typical): EARTHWORKS, DRAINAGE, TBM-EB, STATION-BOX, FITOUT, TESTING. It classifies and styles at once. |
| Show on linear | Text | Y on the few hundred activities that belong on the drawing. Mobilisation, a slurry plant, record drawings are real work that happens nowhere; leave them off. |
An afternoon's work: build a layout with those columns, filter to the activities that belong on the drawing, copy the grid to Excel, fill it there, paste it back, and sort on start chainage to catch the typos. Named locations (a station, a segment) can stand in for the two numbers, with the chainages supplied once in the tool. Summary bands, if you want them, are level-of-effort activities in their own WBS branch, tied SS to the first activity they cover and FF to the last, with no successors and no constraints, so re-scheduling the file moves nothing.
Drawing it in Trestle Path Analytics
- Load the XER (or MS Project XML). Open Linear Schedule.
- Step 1 scans the file and proposes each setting with its evidence: which fields hold the chainages, the style code, the flag, the unit (metres, feet, US stations), the orientation. Confirm; a saved setup skips this next time.
- Read the drawing. Fifty to four hundred marks is a sheet a reader can use; the banner counts what was drawn and the Unplaced tab lists what was held back and why.
- Open Conflicts: overlaps on both axes are two crews in one place at one time. Add the site strips (crews, ground, work fronts) if you want them.
- Export the workbook. Edit the drawing in Excel if you need to (labels, a hand-placed activity, a mark's kind), and import it back: the spreadsheet is then the source for the drawing, the schedule file is untouched, and one click reverts.
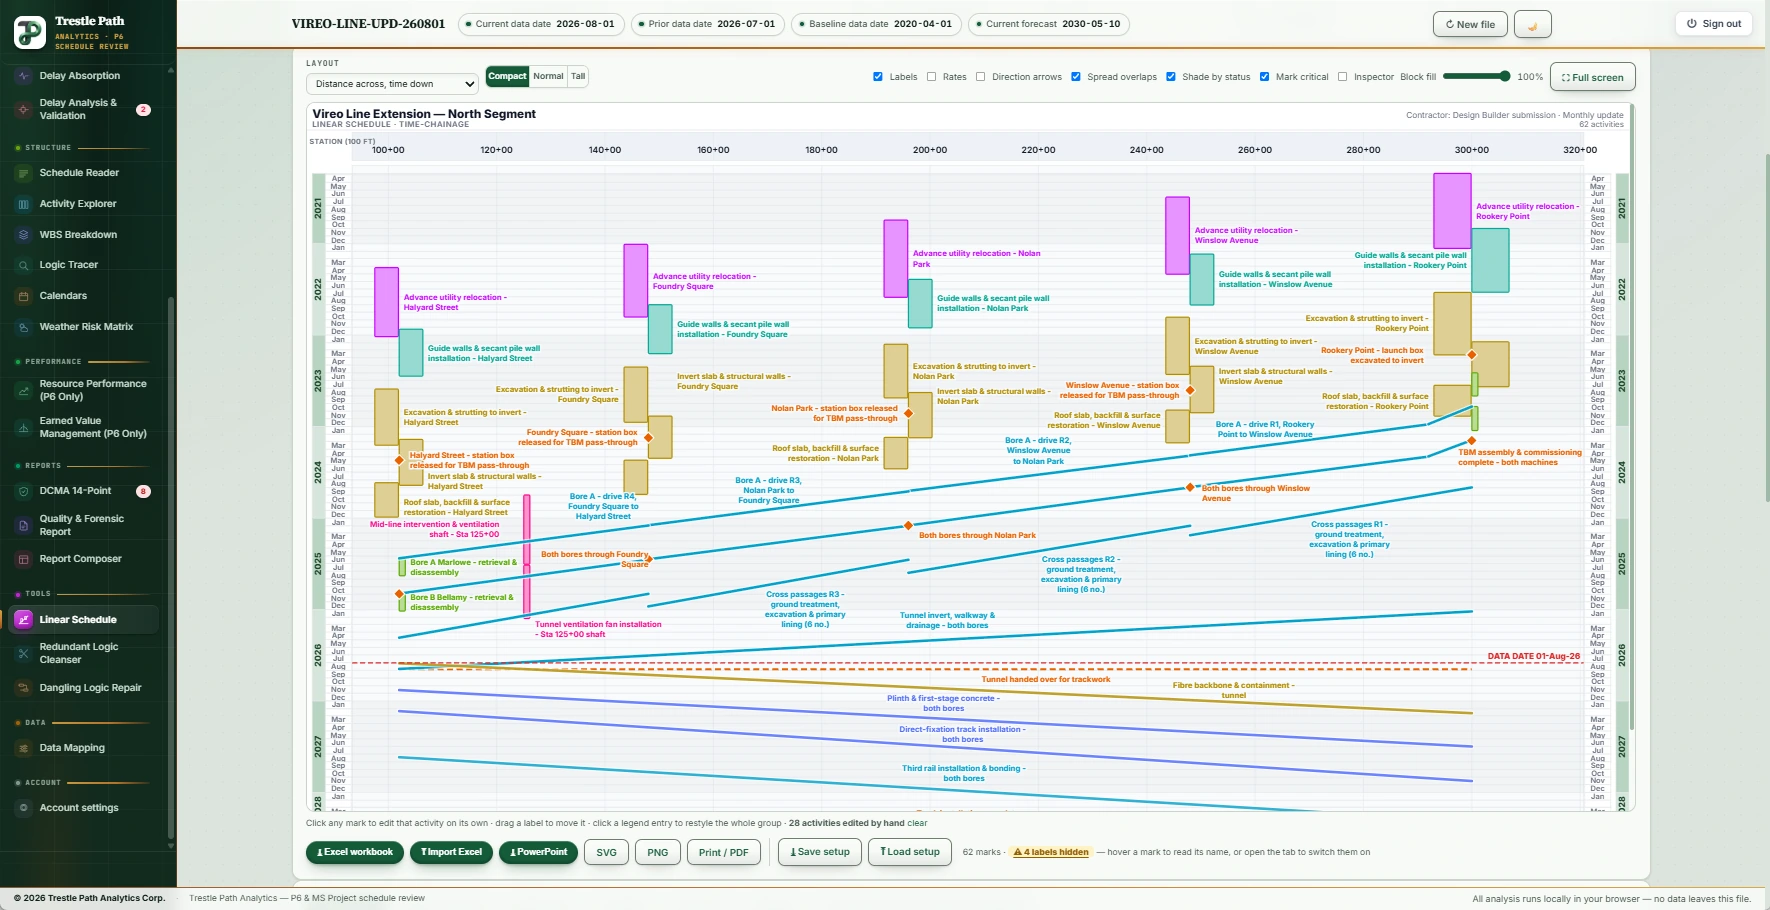
Worked example: a metro extension
The Vireo Line Extension is a fictional 22,200 ft twin-bore metro extension with five underground stations, supplied with the product as a demonstration set; nothing in it is real. Its schedule is coded for the drawing: start and finish chainage in US stations, a linear shape code, a "show on linear" flag, and a location code for the band under the ruler. Of its 210 activities, 64 are drawn; the rest are real work that happens nowhere and are flagged out, because putting everything on the sheet turns it into a smear.
| Station | Centre | Box extent | Built |
|---|---|---|---|
| Rookery Point (launch box, northern terminus) | 300+00 | 293+00 – 307+00 | first |
| Winslow Avenue | 248+00 | 243+50 – 252+50 | +3 months |
| Nolan Park | 196+00 | 191+50 – 200+50 | +6 months |
| Foundry Square | 148+00 | 143+50 – 152+50 | +9 months |
| Halyard Street (TBM retrieval; tie-in to the operating line) | 102+00 | 097+50 – 106+50 | +12 months |
Two earth-pressure-balance machines launch from the northern box and drive south through the four intermediate boxes to Halyard Street. That geometry is also the logic: a machine cannot pass a station box that has not been excavated to invert, so the boxes are built in drive order, three months apart, and on the drawing the five station campaigns read as a staircase rather than five identical columns. Each drive is a rate, its length divided by a planned 44 ft per working day, so the slope of every drive line reads back the rate that was planned; the initial drive is a separate activity at a third of the sustained rate, ending at the milestone the industry calls "fully buried". The data-date line crosses the drive diagonals where you read whether the machines are ahead or behind. Utility relocation runs down the alignment ahead of the boxes as one crew, and station fit-out waits for tunnelling to finish because every box is a logistics site for the drives. None of that is visible on a bar chart; all of it is the shape of the drawing.
Limits
- The drawing is read from the schedule, never written back. Chainages come from the file; if they are wrong there, they are wrong here, and the first-run checklist (does the axis span the project you know, do the drives slope the way the work goes) is how you find out.
- A P6 layout cannot travel in an XER. Add the four columns once in P6 and save the layout; the spreadsheet download gives the same view.
- Survey equations must be resolved into one continuous running distance before the chainages are entered; the tool draws one distance system per alignment.
- Too much on the sheet says nothing. The flag exists so that the few hundred activities with a physical work front are drawn and the rest are not.
Where to find it
Linear Schedule is a module: included in the Expert plan, available as an add-on to Reader or Analyst, and open in the fourteen-day trial. Current prices are on the pricing page. The section's guide includes a specification clause you can paste into a scheduling specification to require time-location presentation from a contractor.
Fourteen days free
Try it on your own schedule
Fourteen days free, no credit card, every section open. Your XER or XML file is read in your browser and never uploaded; only anonymous numbers reach the calculation service, and nothing is stored.