
What the page is
The composer has three panes: the Blocks library on the left, with a search box and a Running order tab; the page in the middle, drawn at true paper size with a mark where each page breaks and a chip counting the pages; and Report setup on the right, for the title page, the starting layouts, paper, margins, accent colour, logo, header and footer.
A block says which chart or register to draw, never the numbers in it. The layout that prints this month's milestones prints next month's on next month's file, and nothing in the report is copied from a screen by hand.
A block the loaded files cannot fill is not offered: a change register needs a prior update, a delay-event register a fragnet, earned value a baseline and resource assignments. Such blocks are listed under Not available for these files, each with the one thing that would unlock it.
The block library
The library holds 57 blocks in seven groups. Each card says what the block prints and shows, in dots, roughly how much page it takes.
| Group | Blocks | What is in it |
|---|---|---|
| Cover & context | 3 | Cover page (title, data date, the files compared, prepared for and by), Basis of review (what was reviewed and what was excluded from every number), Contents |
| Headline | 4 | Verdict & grade, two KPI strips (schedule position, schedule quality), Top exposures |
| Charts | 12 | DCMA ribbon, total float profile, duration distribution, progress S-curve, monthly velocity, milestone movement, biggest date movements, WBS branch health, critical-path Gantt, seasonal risk matrix, delay absorption curve, time-chainage diagram |
| Registers | 22 | Key milestones, this period's changes, changed actuals, constraint changes, added and deleted activities, float erosion, delayed activities, the critical path, the DCMA table, red flags, open ends, constraints, out-of-sequence progress, riding the data date, logic changes and rewiring, near-critical work, LOE and WBS Summary, calendars, duplicate names, the Schedule Reader's view, the comment log |
| Delay claim | 7 | The result of Delay Analysis & Validation, the delay-event register, findings, modelled impact and before-and-after, and the windows and drift chart of a delay analysis over months |
| Resources & value | 4 | Earned value (SPI and SPI(t)), the resource histogram and S-curve, financial periods, and the contractor's stored earned value |
| Narrative | 5 | Executive summary, critical path narrative, your own commentary, a picture, a page break |
Some blocks print what is set up on another page: the critical-path Gantt uses the Critical Path page's renderer and choices, the Reader extract prints the Reader's current view, and the delay blocks print what Delay Analysis & Validation modelled. Change the page next door and the block follows.
Seven starting layouts
Each layout is an ordered list of blocks shaped by what that report is for, and only a starting point. Blocks the files cannot support are dropped as it is applied, and a few entries are placed only when they would print content rather than an instruction.
| Layout | What it is for |
|---|---|
| Monthly owner report | The owner's monthly update review: completion against the prior update, the baseline and the contract, key milestones, what changed this period, the critical path, delays, quality and red flags, and earned value when a weight resource is nominated |
| Executive one-pager | The verdict, where the schedule stands, the three findings that matter and one chart, for a director |
| Forensic / claims pack | Evidence-led: what moved, what was edited, what has been carried, how much slip the network absorbs, and the delay-event pages when the schedule carries a fragnet |
| DCMA / compliance check | The schedule-acceptance submission: the DCMA 14-Point table with the registers behind each failing check |
| Baseline acceptance (78R-13) | A plan before it is approved: complete logic, measurable durations, a traceable critical path. No change registers, by design |
| Schedule review pack | What you send back: the Schedule Reader's view as an extract, the comment log, then the critical path, milestones and exposures behind them |
| Resources & earned value | SPI and SPI(t) against the baseline, the resource curves behind them and the financial periods |
Working on the page
- Run the review, then open Report Composer. Pick a layout under Starting layout, or start from an empty page.
- Add blocks by dragging a card onto the page, by its + button, or by double-clicking it. A card already on the page shows how many times it is placed.
- Reorder by dragging a block's grip, with its ▲ and ▼ buttons, or in the Running order tab, which is also the route on a phone.
- Set a block's width to full, half or a third of the page from the three buttons on its bar; two half-width charts then sit side by side.
- Open a block's settings (⚙): a heading of your own, the explanatory note hidden or kept, a caption. A table offers Rows to show, up to All; when it is cut, a line under it says how many of how many are printed, and that line cannot be hidden.
- Place a Page break wherever the next section should start on a new page. The cover forces one after itself.
- Set the paper (Letter, A4, Legal, Tabloid), orientation, margins, density and accent colour. A block's own Page orientation (Auto, Portrait, Landscape) can override it; Auto prints a full-width table too wide for portrait on a landscape page of its own.
Four blocks grade against the DCMA thresholds: the verdict, the quality KPI strip, the DCMA ribbon and the DCMA table. Their settings carry the eleven limits; a change there grades that block only and prints a footnote saying so, so a report can follow a contract's acceptance criteria while the dashboard keeps its own. Apply to the whole dashboard is the separate step for when the project's criteria have changed.
Your words, and your pictures
Two blocks are written from the analysis. The Executive summary states the position at the data date, the movement against the prior update, the quality result and the findings that most affect reliance on the schedule. The Critical path narrative says what drives the finish, where the path is concentrated, what CPLI reads and how much work sits within ten days of critical. Each has a length setting: short, standard or full.
The rest of the words are yours. Your own commentary is a free-text block with its own heading: a covering note, a caveat, the reason a number looks the way it does. Click it on the page to write. A Reviewer's caption puts a sentence of your own under any chart or table.
The Picture block takes a PNG, JPEG, GIF or WebP: a site photograph, a marked-up screenshot, a plan, at 100, 75, 50 or 33 per cent of the column. A logo can sit on the cover page and the deck's title slide. Pictures are scaled down as they are added, so a layout stays small enough to travel in a template.
PDF, Word, PowerPoint, Excel
All the exports read the same composed page, so a block added once appears in every format.
| Export | What you get |
|---|---|
| The browser's print window opens with the paper, margins, orientation and page numbers already set; choose Save as PDF. Text stays text, a long table runs across as many pages as it needs with its header repeated, and the margins carry the report title and data date at the top and the preparer and "Page N of M" at the foot. The cover prints bare | |
| Print… | The same document, to a printer |
| Word | A real .docx: Heading styles, so the navigation pane works; text and tables you can edit, comment on and track changes in; the KPI, verdict and red-flag graphics as native tables; charts as pictures; a running header and page numbers. Margins of 1 inch, or the page's own |
| PowerPoint | Not a screenshot of the report: tables become PowerPoint tables, the KPI tiles, scorecard and severity chips are rebuilt natively, and charts are images. One block per slide, or short blocks packed onto the slide above when they fit; a long register splits across slides with its header repeated and the row range stated |
| Excel | Every table on the page as its own sheet, the headline figures and the verdict on a sheet of their own, the findings on another, and the narrative beside them. Charts stay in the other exports |
Before any export the composer lists the blocks that would print an instruction instead of content (a commentary not written, an analysis not run, a weight resource not chosen) and offers to leave them out of this export, export as it is, or go back. A block that found nothing is content: "no constraint changed this period" is a finding.
Save template writes the layout to a small file: the running order, every block's width and settings, your commentary and pictures, the page setup and the title-page text, but no schedule data. Load template applies it to any project and says how many blocks were applied and which ones these files cannot fill. The composer also remembers the last layout in your browser, and Save session in the top bar keeps it with every other page's settings.
Worked example: the monthly report for a metro extension's August update
The Vireo Line Extension is a fictional twin-bore metro extension with five underground stations, supplied with the product as a demonstration set; nothing in it is real. The August 2026 update (data date 2026-08-01) was loaded with the July update as the prior and the 2020 baseline. With all three files loaded, 52 of the 57 blocks are offered; the other five wait on an action elsewhere: a Delay Absorption run, a Linear Schedule set-up, a delay analysis over months on Delay Analysis & Validation (two blocks), and a comment in the comment log.
Monthly owner report places 28 blocks: 22 blocks of content and 6 page breaks. Three entries of the layout are left out because they would have printed an instruction: the delay analysis result (no analysis has been run), earned value (no weight resource is nominated, so the S-curve block prints a duration-weighted indicator and says it is not earned value) and the comment log (no comment has been raised). The default title is "KB-VLX — Schedule Review, August 2026 Update". On Letter portrait with normal margins the canvas counts 13 pages.
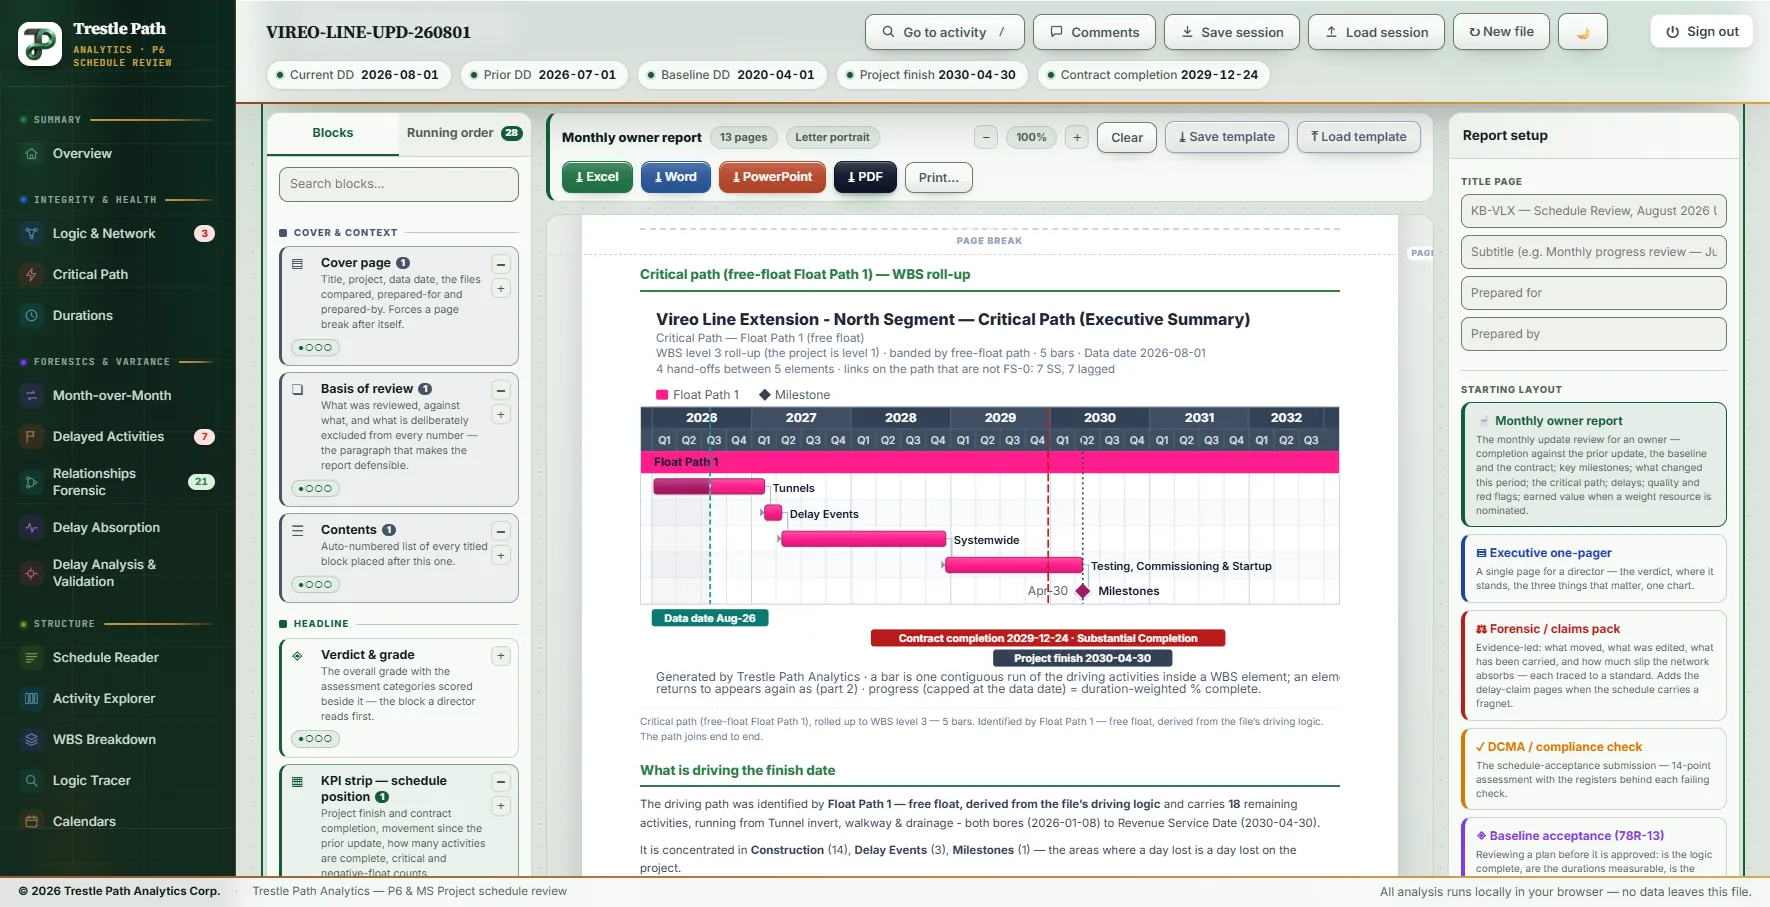
The executive summary writes itself from the review: 130 of 207 work activities complete and 77 remaining; completion forecast on 2030-04-30, driven by a critical path of 18 remaining activities identified by Float Path 1; the forecast improved by 78 days against the July update while no activity was completed and one started; 59 forecast finishes moved later and 13 earlier; 15 relationships added and 9 removed; 7 of the 13 applicable DCMA checks pass; no negative float; and the comprehensive workbook opens on fail, set by its update-review scorecard. The blocks behind those sentences carry the detail:
| Block | What it prints for the August update |
|---|---|
| Verdict & grade | C, 62 / 100 |
| Key milestones | Revenue Service Date 2030-04-30, −78 d against July, +25 d against the baseline, +153 d inside its imposed 2030-09-30; Substantial Completion 2029-12-24, −64 d, +38 d inside 2030-01-31 |
| What changed this period | Finish −78 d · activities +9 / −3 · relationships +15 / −9, 5 retyped · 3 constraints · 11 original durations (9 cut) · 4 actual dates on 2 activities · 33 lost float |
| Changed historical actuals | VL-NP-3140 started 9 days later and finished 8 days later than July reported; VL-FS-3140 started and finished 6 days earlier |
| Top exposures | Six medium findings, led by out-of-sequence progress (2 activities) and the changed historical actuals |
| Quality KPI strip | DCMA 7 / 13 · 0 open ends · 2.00 links per activity · 0 hard constraints · 2 out of sequence · CPLI 1.11 |
The other layouts on the same files: the DCMA / compliance check places 12 blocks on 6 pages; Baseline acceptance 22 on 9; Schedule review pack 11 on 7, without the comment log until a comment exists; Resources & earned value 12 on 6, with its earned-value block asking for the weight resource first. The Forensic / claims pack places 23 on 12 pages and leaves out the absorption curve, because Delay Absorption has not been run. Its four delay-event blocks are placed, since the August update carries a fragnet, but print an instruction until Delay Analysis & Validation has modelled the events, and the pre-export check lists all four.
Limits
- The page count is the canvas's estimate. The canvas moves a block that does not fit to the next page; the PDF goes through the browser's print engine, which lets a long table run on and sets its own margins. On the monthly report above the canvas counts 13 pages and Chrome printed 14, and the Executive one-pager lays out on two pages at Letter portrait on this file. Read the PDF before you issue it.
- It reports the review, it does not perform one. Delay blocks need Delay Analysis & Validation run, the time-chainage block the Linear Schedule set up, the seasonal block the location confirmed on the Weather Risk Matrix.
- Earned value only on a nominated weight. Without a progress-weight resource chosen on the Earned Value Management page, the S-curve block prints a duration-weighted indicator labelled as such, never an SPI.
- Charts are pictures outside the PDF. Word and PowerPoint carry them as images; the Excel export leaves them out. The PDF itself needs Save as PDF chosen in the print window, with the browser's own headers and footers off.
Where to find it
The Report Composer is included in the Analyst and Expert plans and in the fourteen-day trial. Current prices are on the pricing page. The registers behind the blocks, tab by tab, are in the comprehensive review workbook; for a full review of the same demonstration files, see the sample review, and for the view the Schedule Reader extract prints, see the Schedule Reader.
Fourteen days free
Try it on your own schedule
Fourteen days free, no credit card, every section open. Your XER or XML file is read in your browser and never uploaded; only anonymous numbers reach the calculation service, and nothing is stored.
RelatedA full schedule review, section by sectionThe Schedule ReaderDCMA 14-point assessment