
What the page answers
Three curves carry the whole answer. Planned on early dates is the baseline's at-completion quantity spread across working time as if every remaining activity ran at its earliest. Planned on late dates is the same quantity on the late dates; the band between the two is the float on the remaining work. Actual is the update's recorded units, reconstructed period by period and stopping at the data date.
Read against that envelope there are three positions, the ones AACE 55R-09 describes: on or above the early curve is on plan; between the curves the work is consuming its float and can still finish on time; below the late curve is the finding. Bars under the curves show how busy the resource was in each week, month, quarter or financial period.
Why the plan has to be the baseline
The only plan-shaped thing inside a statused schedule is its own Budgeted Units spread over its planned dates, and that is not a plan. On the usual settings P6 drags an assignment's planned dates onto its actual dates once work starts, so for every period already past the "plan" has quietly moved onto the actuals. A plan-against-actual drawn from it flatters the result by construction.
So the page reads three files, each for one thing:
| Slot | What it supplies | Without it |
|---|---|---|
| Current update | The actual units, the data date, this update's at-completion totals | Nothing to read |
| Baseline | The plan: the baseline's at-completion per assignment, on its early and on its late dates | No plan curve; every plan-relative reading says baseline required, and the facts (totals, actuals, assignments) are still shown |
| Prior update | What last month forecast for the window between the two data dates, against what was delivered in it; changes to closed financial periods | No month-on-month block |
The export must carry the resource assignments (P6's TASKRSRC rows), the calendars with their parents, and the resource curve library. An XER exported without assignments has nothing to phase, and the page says so rather than drawing an empty chart.
Two percentages, two denominators
Actual per cent complete is P6's own Units % Complete: actual to date divided by this update's at-completion total. Planned per cent divides the plan to date by the baseline's at-completion total. When the two totals differ, and on a live job they usually do, the difference between the percentages mixes progress with scope. The page therefore prints three more readings beside them:
| Reading | What it is | When to quote it |
|---|---|---|
| Progress variance | Actual per cent minus planned per cent, in percentage points, against early and against late | When the two at-completion totals agree |
| Unit variance | Cumulative actual minus cumulative plan, in units | Whenever the totals differ: it has no denominator to distort it |
| Scope variance | This update's at completion minus the baseline's | Always beside the others: it is the movement neither percentage can show |
The difference between two percentages is written in percentage points, never as a per cent: a plan of 60 per cent and an actual of 50 is 10 points short, which as a ratio is 17 per cent short. Both are true and they are different numbers, so the page keeps them apart.
How a total becomes a curve
An assignment row in an XER carries a lump: a budgeted, actual and remaining quantity, a planned and an actual window, and optionally a pointer to a resource curve. It does not say what April looked like. Every tool has to calculate that, and two tools calculating it differently will agree on every total and disagree on every period. The page uses P6's rules, so its figures can be checked against P6's own Resource Usage Spreadsheet:
- The activity's calendar, merged with the global calendar it inherits from, so an inherited shutdown is not filled with work. A resource-dependent activity uses each resource's own calendar.
- Working minutes: a ten-hour day carries more than a six-hour day, a non-working day carries nothing, and the first and last days are read by the clock.
- P6 resource curves: twenty equal slices of working time, applied cumulatively. With no curve, the quantity is proportional to working time.
- Actuals stop at the data date, read at the exact instant the file stores, and include overtime. A half-finished assignment has consumed the front of its curve, not a squashed copy of the whole.
- Days first, then weeks, months, quarters or financial periods, so every timescale returns the same totals and the same readings at the data date.
Financial periods: the stored record
Without stored periods an XER holds only cumulative actuals, and every tool, P6 included, redraws their shape at each update: history is rewritten every month. When the contractor runs P6's Store Period Performance, the file carries each period's actual as it was reported, and for every assignment the actual to date equals the stored periods plus the actual this period. The page checks that identity on every assignment, reports the last store and how long the open period has run, and offers two shapes for the actual: As P6 calculates (the default, which reconciles with P6's ordinary columns) or Stored periods (the record). With Stored periods chosen, a diamond also marks the cumulative actual stored at each period end; the calculated view draws none.
Stored periods can be edited after the event in P6, with nothing in the file to say so. With the prior update loaded, the page compares every period the prior file had already closed with the same period now, and lists every stored value that changed, disappeared or appeared.
Running it
- Load the current update, the baseline in the Baseline slot and, if you have it, the prior update. Open Resource Performance.
- Pick the resource from the picker, by type or by typing a few letters of its ID or name. A value resource carrying the whole project is usually the first to read.
- Name the unit on the chip if P6 did not: P6 gives a unit only to material resources, so a cost or value line arrives reading as hours. It is a label; nothing is converted.
- Read the six tiles, then the chart. Switch the timescale, the plan basis or the actual shape as the question needs.
- Open All resources to see where the loading actually is, and which resources moved most against the baseline.
- Export the workbook, the chart (PowerPoint, PDF, PNG, JPG, SVG), and save the setup for next month.
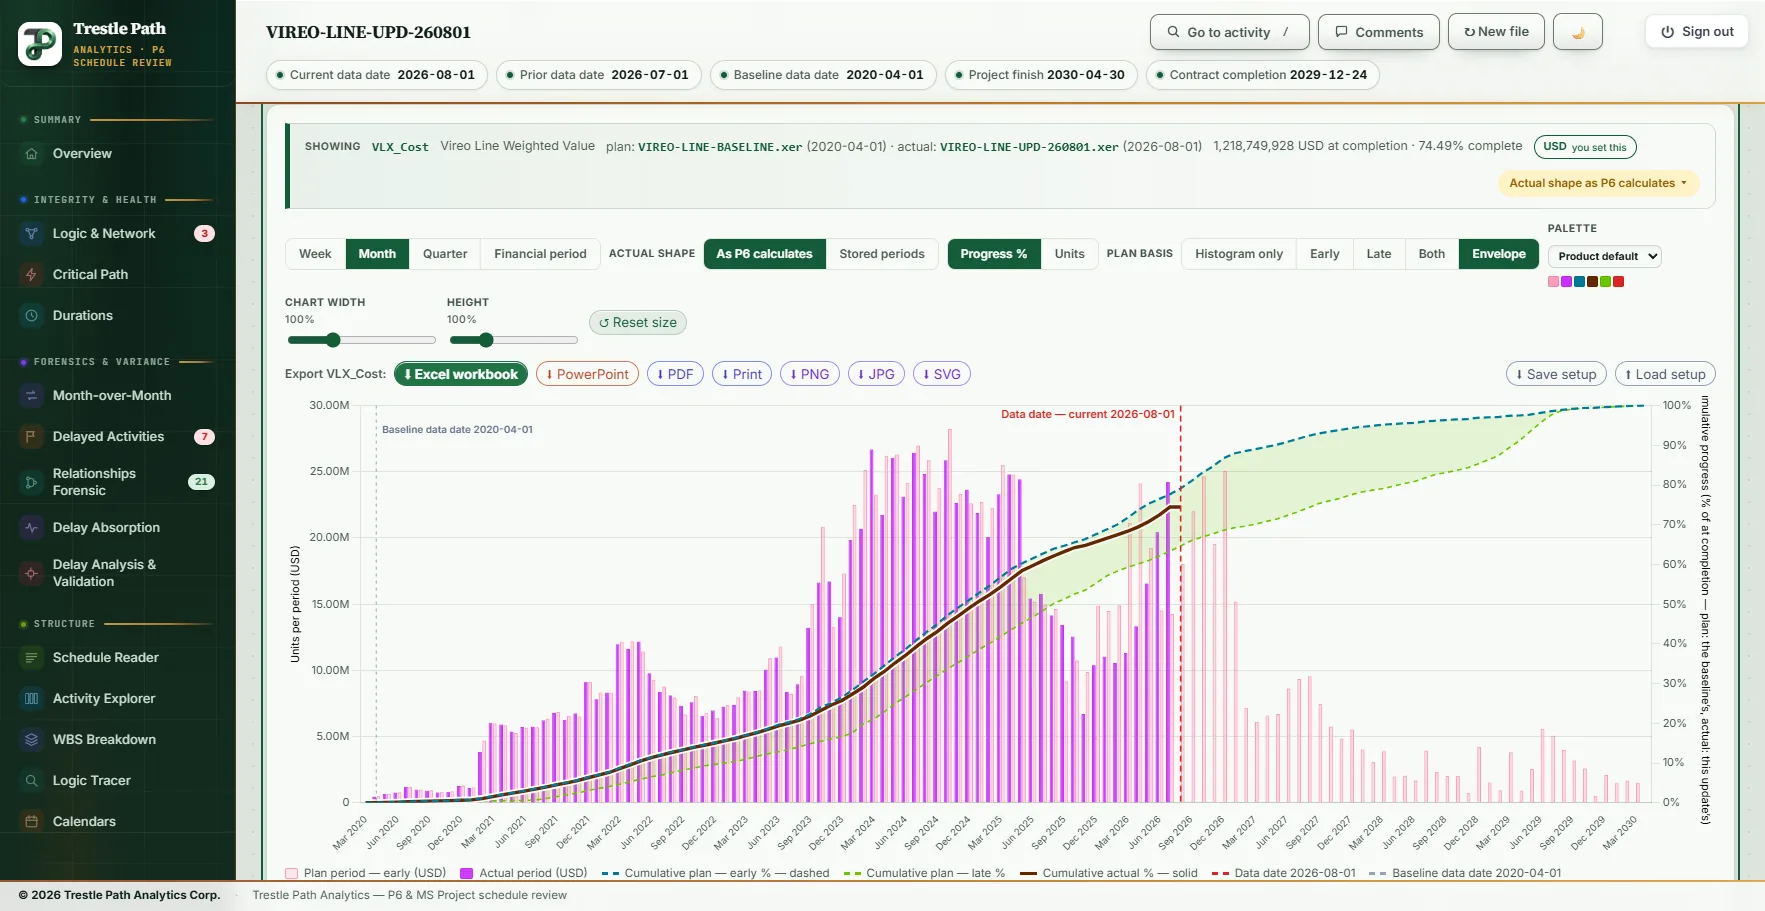
Worked example: a metro extension
The Vireo Line Extension is a fictional twin-bore metro extension with five underground stations, supplied with the product as a demonstration set; nothing in it is real. Its August 2026 update was read against its baseline, with the July update as the prior. Twenty-two resources carry a budget: labour crews, equipment, materials and one value resource. The schedule stores financial periods.
The project's value
One nonlabour resource, Vireo Line Weighted Value, carries the contract value on 176 assignments, the common way an owner's specification asks for a cost-loaded schedule. P6 gives it no unit, so the unit was named as USD on the chip. At the 1 August 2026 data date:
| Reading | Value | What it says |
|---|---|---|
| Actual % complete | 74.49% | 908.2 million earned of this update's 1,219.3 million at completion |
| Planned % — early / late | 77.68% / 63.37% | Where the baseline put the project by now on its early and on its late dates |
| Progress variance | −3.20 pp | Inside the envelope: consuming float, 3.2 points short of the early plan and 11.1 above the late |
| Unit variance | −38.6 million | Earned value short of the early plan to date |
| Scope variance | +0.53 million | Holding: under one per cent of the agreed total |
The scope is holding, so the percentages can be read at face value here: the project is consuming float, not yet behind its late plan. 76 stored periods hold all of the actual, and the last store was July 2026, so the whole of that history is on the record rather than recalculated.
When the total moves: the electrical crew
The Electrical resource reads 39.40 per cent complete against an early plan of 49.45 per cent: 10.06 points short. But its at-completion has grown from 771,200 hours in the baseline to 885,584 now, +114,384 hours (+14.8 per cent), past the 10 per cent line where the page calls a resource materially re-scoped. Against the approved total the same 348,896 hours are 45.24 per cent, 4.21 points short, and in units the crew is 32,481 hours behind its early plan. The ten points are mostly the denominator. The finding is the scope growth, and it is on the Scope variance tile, not on either percentage.
When "behind" means over-consumed: the tunnel crew
The Tunnel Crew was planned to be finished by now: 100 per cent on both curves. It reads 98.98 per cent complete, 1.02 points short, and the chip says behind the late curve. In units it has booked 19,484 hours more than the plan to date, because its at-completion has grown by 27,180 hours to 757,280. The work is not late in the sense the percentage suggests; the tunnel has cost more crew hours than budgeted. That is the question to ask, and only the unit and scope variances show it.
Where the loading moved
The All resources table ranks every resource by how far its at-completion has moved from the baseline. On this update the top of the list is Architectural Finishes (+199,100 hours, +26.2 per cent), Utility Relocation Crew (+20.9 per cent), Trackwork Crew (−19.3 per cent, a smaller total than the baseline's) and Mechanical & Plumbing (+18.6 per cent). A project-level total that is holding can hide crews that are not; this table is where they surface.
What to ask for in a resource-loaded submission
- Budgeted units on every assignment, and units statused each period, not only dates. An actual line that stops short of the data date usually means dates were statused and units were not.
- One meaning per resource. A value resource that also carries a crew's real hours cannot be read either way, and no manpower conclusion may be drawn from a cost-loaded schedule.
- Store Period Performance every cycle, into the right period, without skipping months: a store after a gap carries both months and the split between them is lost.
- A unit of measure on material resources, and resource curves chosen where the spread is not even, as a decision rather than a default.
- The export with assignments and complete calendars, and, where a figure is disputed, P6's own Resource Usage Spreadsheet for the resource in question beside the XER.
Limits
- P6 XER only. MS Project files do not carry the assignment, curve and financial-period tables this page reads.
- The schedule's own claim. The actual is units as the contractor statused them: exact as recorded, not verified, not invoiced and not paid.
- Three things the shape cannot see. A suspend and resume on an activity, a calendar exported without its parent, and timesheet-driven actuals. Each announces itself as a disagreement with P6's Resource Usage Spreadsheet on the assignments concerned; the totals stay exact.
- Judgement bands. The colour bands (the 0.95 attainment line, the 1 and 10 per cent scope lines, the 20-point wide-envelope line) are conventions, not standards, and every number is printed so a reader can disagree.
Where to find it
Resource Performance is included in the Analyst and Expert plans and in the fourteen-day trial, for Primavera P6 schedules. Current prices are on the pricing page. The section's guide covers the method in full: every tile and its denominator, the chart's controls, the curve rules, financial periods, the exports and the settings in P6 that make the page accurate.
Fourteen days free
Try it on your own schedule
Fourteen days free, no credit card, every section open. Your XER or XML file is read in your browser and never uploaded; only anonymous numbers reach the calculation service, and nothing is stored.
RelatedHow to compare two P6 updatesA sample schedule reviewPlans and pricing