
What it shows
Every activity sits in its WBS band, in P6's own order (the WBS sequence number, then code), stepped in one level at a time with a stripe for each ancestor, so the eye follows the structure the way it does in P6's Activities window. A band shows its dotted WBS code and its name, and rolls up the activities beneath it:
| Band field | How it rolls up |
|---|---|
| Start, Finish | The earliest start and the latest finish beneath it; the finish carries "A" once everything in the band is done |
| Total float | The lowest float among the unfinished activities |
| Activity % complete | Weighted by original duration, finished work counted at 100 |
| Durations | The band's own span, measured in working time on the band's calendar (one calendar if every activity shares it, otherwise the project calendar), not a sum of its activities |
| BL Start, BL Finish, variances | The same roll-up on the reference schedule |
The Reader shows the whole file. Activities filed under a WBS named as retired, inactive or deleted are listed in their band here, while the analytical pages leave them out of every count; that is why the Reader can show a few more activities than the Activity Explorer on the same file.
It reads up to three files, and one switch decides what the baseline columns compare against:
| Slot | What it adds to the Reader |
|---|---|
| Current update | The schedule being read |
| Prior update | With BL from: Prior update, every BL column, both variances and the band roll-ups measure what moved this month |
| Baseline | With BL from: Baseline, the same columns measure the total drift from the approved plan |
Variance takes P6's sign, baseline minus current, so a negative number is late; it is counted in working days on the activity's own calendar, as P6 counts it.
What most people never find
| Capability | Where it is | What it is for |
|---|---|---|
| Search reads more than IDs and names | The search box (/ jumps to it) | It also matches the WBS path, every activity-code value, every user-defined field and the notebook text: type a crew, a chainage or a word from the scheduler's notes |
| Ten layouts | Layout | Column sets for a purpose: Classic, Progress / Update, Baseline / Variance, Critical / Longest Path, Float / Near-critical, Constraints, Logic / Open Ends, Durations, Milestones, Linear Schedule (chainage) |
| Review columns P6 users rarely add | Columns… | Claim gap (physical minus duration per cent), Calendar hours/day (red where the stored hours disagree with the calendar), Expected Finish, Secondary Constraint, External Early Start and Late Finish, Predecessors and Successors, the Notebook, every activity code and user field |
| A real advanced filter | Advanced filter… | Any column, with all/any, operators by field type, a pick list of the values actually in the file, and a live "N of M activities match" as you build it |
| A period window | Period | Presets (Around data date, Next 30d, Next 90d, Last 90d) or a two-handle slider over a histogram of the schedule's density. It counts anything that overlaps the window, and a preset is recalculated from each new file's data date |
| Group by any field | Group | WBS, any activity code, calendar, status, total float band, resource, activity type, constraint, the month it starts or finishes. Group bands roll up, fold, print and export like WBS bands |
| The driving chain | Options → Relationship lines → Selected → Driving chain | Traces what drives the selected activity, backwards and forwards, draws it, and can show only those rows |
| Links you can read | The chart | Lines take orthogonal routes, so FS, SS, FF and SF read from their shape; a selected link is labelled with its type and lag; a link into a folded band ends on the band |
| Review comments on the activity | Finding in the activity drawer, and Findings | Question, Concern or Non-compliant, with the activity's facts frozen at the moment of raising; flagged on the row; exported as a comment log with two empty columns for the response |
| Next month in one click | Save setup, Load setup, Views | Columns, widths, filters, period, group, chart options, saved views and the comment log in one file, applied to the next update. Loading lists anything that did not apply |
| The whole review, kept | Save session and Load session in the top bar | Every page’s settings and the comment log in one file on your computer, with a record of which schedules were open (never the schedules). Open the same files another day, run the review, load the session, and it is all back; closing with unsaved changes asks first |
| Three ways to hand it on | Export to Excel, Print / PDF, Web sheet | A workbook with a real Excel outline; an A3 landscape sheet with a chart column; a single web page anyone can open without the product |
| Send a set elsewhere | Send to | The rows on screen to the Activity Explorer, the selected activity to the Logic Tracer, the set to the Linear Schedule, or the IDs to the clipboard, one per line |
Eight recipes for a monthly review
Each recipe answers one question a reviewer asks every month. The checks themselves are the ones AACE 53R-06 lists for an update review (changed actual dates, calendar changes, relationship and constraint changes, progress on the critical path) and AACE 78R-13 for a baseline (constraints, open ends, long durations); the Reader is where they are quickest to see.
1. The first ten minutes with a new update
- Load the update, last month's update in the Prior slot and the baseline in the Baseline slot. Open Schedule Reader.
- Press Level 1, then 2: the structure, with each band's start, finish, float and per cent. A band at 100 per cent with no "A" on its finish holds work reported complete in per cent but not finished, and is the first question.
- Set Group to Calendar: every calendar in use, with the activities on it. A new calendar, or critical work on a seven-day calendar, moves dates without a logic change and belongs in the narrative; the Calendars page compares them with last month shift by shift.
- Set Filter to Delayed vs Baseline: work the baseline says should have started or finished by the data date and has not.
2. What moved this month
- Set BL from to Prior update and Layout to Baseline / Variance.
- Click the Variance - BL Project Finish Date title: the sort runs inside each band, so the worst slip in every part of the job is at the top of its band.
- Switch BL from back to Baseline to see the same activities against the approved plan. The first answers "what changed this month", the second "how far has it gone in total"; the narrative should explain both.
3. Which critical path?
Three filters answer three different questions, and on a real schedule they rarely return the same list. Critical path (Float Path 1) is the chain that drives the project finish, as this review derives it from the network. Longest Path is P6's own flag, as stored when the contractor last scheduled the file. Total float ≤ 0 is a population: every unfinished activity with no float, whatever it drives. Where the three disagree, the difference is a finding in itself, and Options → Colour bars by → Total float shows where the float actually sits, with the near-critical threshold set in days for the project.
4. Why is this milestone where it is?
- Open Options, set Relationship lines to Selected, then Driving chain.
- Click the milestone's bar or row. The chain is traced backwards to what drives it and forwards to what it drives, and summarised as steps in each direction.
- Press show only these: the table keeps the chain alone, still inside its WBS bands, with the driving links drawn.
- Click any Activity ID for its drawer. The Predecessors and Successors tables say which link drives (Driving) and, for every link that does not, by how much it misses (No · +12d). The name opens the Logic Tracer on that activity.
5. Float health in one screen
- Set Group to Total float band: negative, zero, near-critical (0–10 days), 10–44 days, more than 44 days, and complete.
- Press Collapse all, then open only the bands you care about. Each band carries its earliest start, latest finish and lowest float.
- A healthy update shows the float spread across the bands; a schedule with almost everything at zero or above 44 days is worth a question before any single activity is.
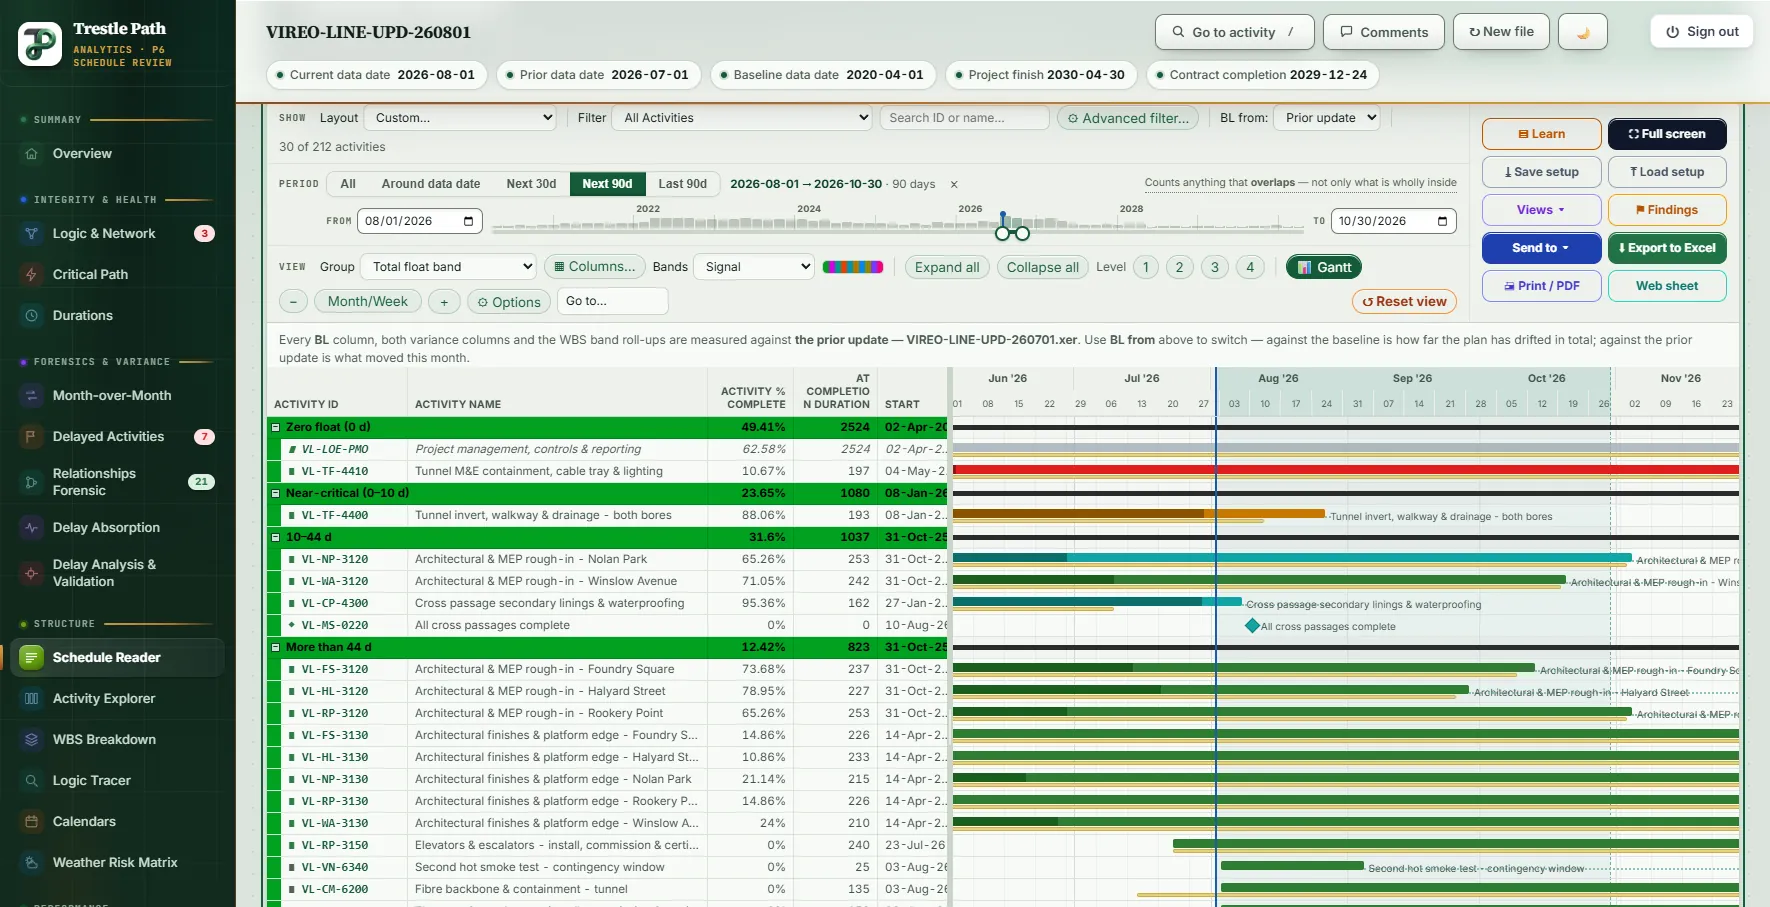
6. A three-month lookahead for the site meeting
- Press Next 90d in the Period row. Anything whose work overlaps the next 90 days is listed, including work already under way.
- Set Group to Month it finishes (or Total float band, as in the figure).
- Press Print / PDF: an A3 landscape sheet with the columns in force, the bands and a chart column. Bands you fold before printing print as one line, so a summary sheet is a fold away.
7. Reading the contractor's coding
- Set Group to Code: Discipline, Code: Responsibility or any other code in the file. An activity with no value lands in its own band, which is often the point.
- Open Columns…: the Activity Codes and User Defined groups list every code and field the file carries. A chainage typed as 12+450 sorts as a number.
- Use Advanced filter… for the questions a code answers: Discipline is Signalling and Total Float < 10 and Start is before a date. The value lists come from the file, so a misspelt code value shows up in the list.
8. Write the comments down, and get the answers back
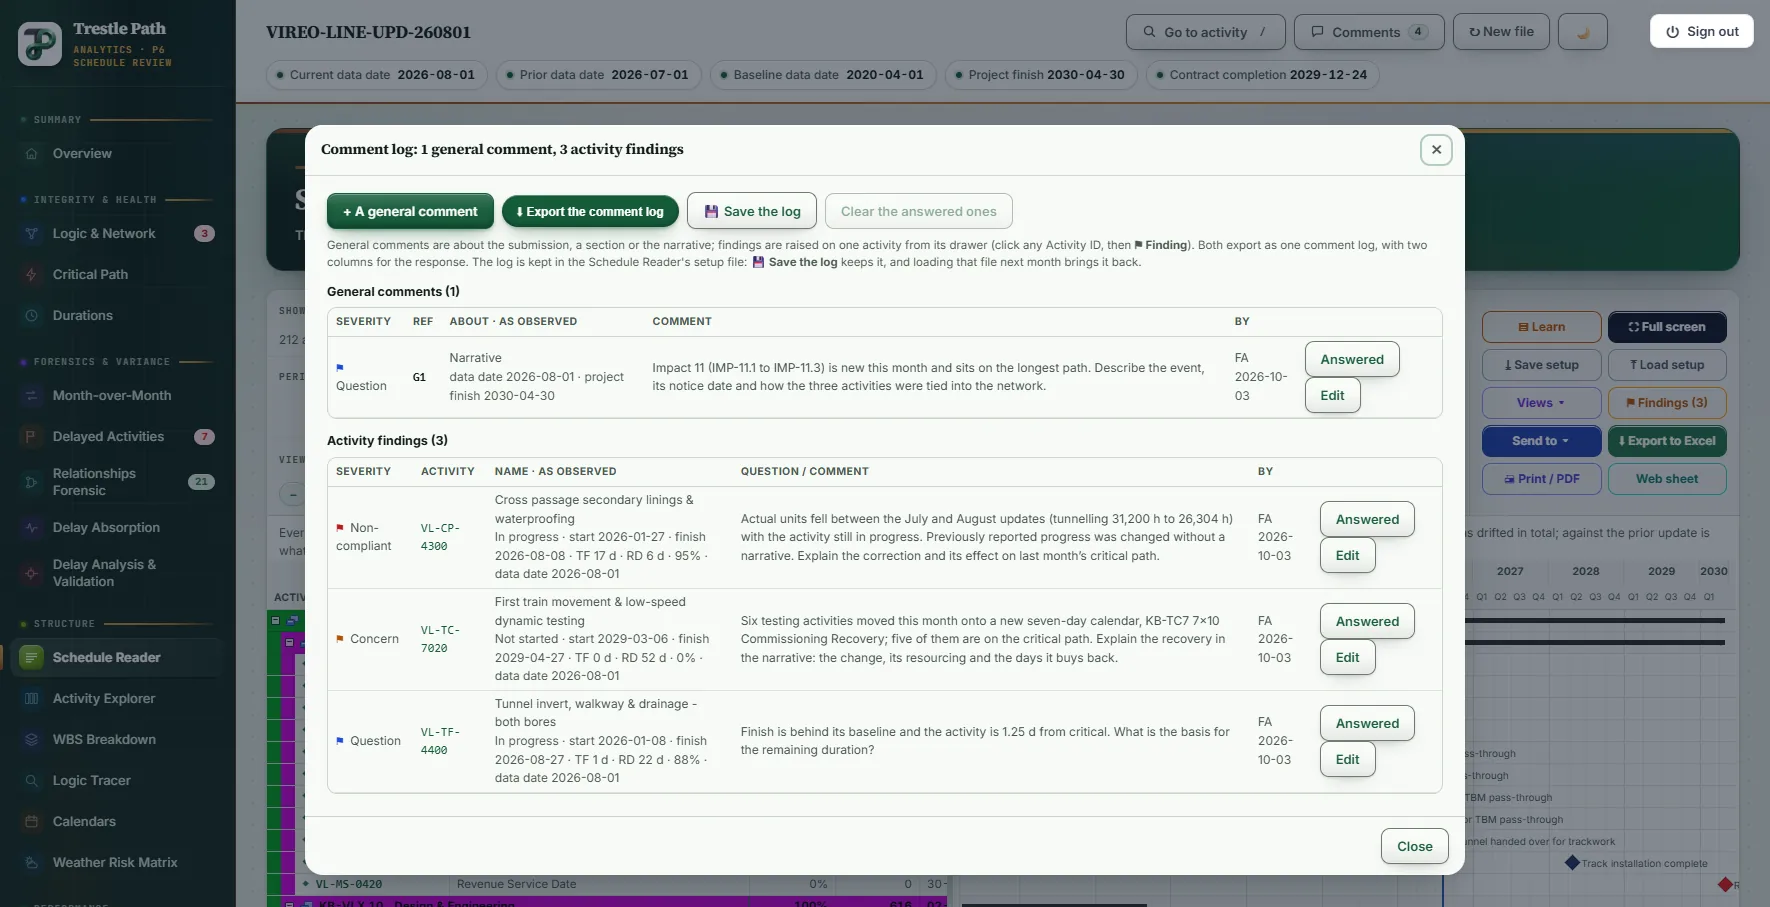
- Click an Activity ID, press Finding, choose Question, Concern or Non-compliant, and write the question. The activity's status, dates, float, remaining duration and per cent at that moment are kept with it, so the comment still makes sense after the next update.
- For the submission as a whole, the narrative or a section, press Comments in the top bar, then A general comment.
- Press Export the comment log: one workbook, every comment numbered, with two empty columns for the contractor's response and its date.
- Press Save the log. Next month, Load setup on the new update brings the log back, each finding flagged on its row; a finding on an activity that has gone is marked as such. To keep the whole review instead, the log and every page’s settings, press Save session in the top bar; Load session on the same files brings all of it back.
Worked example: a metro extension's August update
The Vireo Line Extension is a fictional twin-bore metro extension with five underground stations, supplied with the product as a demonstration set; nothing in it is real. Its August 2026 update (data date 1 August) was read with the July update as the prior and the 2020 baseline. The file holds 212 activities, two of them under a WBS named Retired Scope, nine calendars, five activity codes and five user fields.
The critical path, three ways
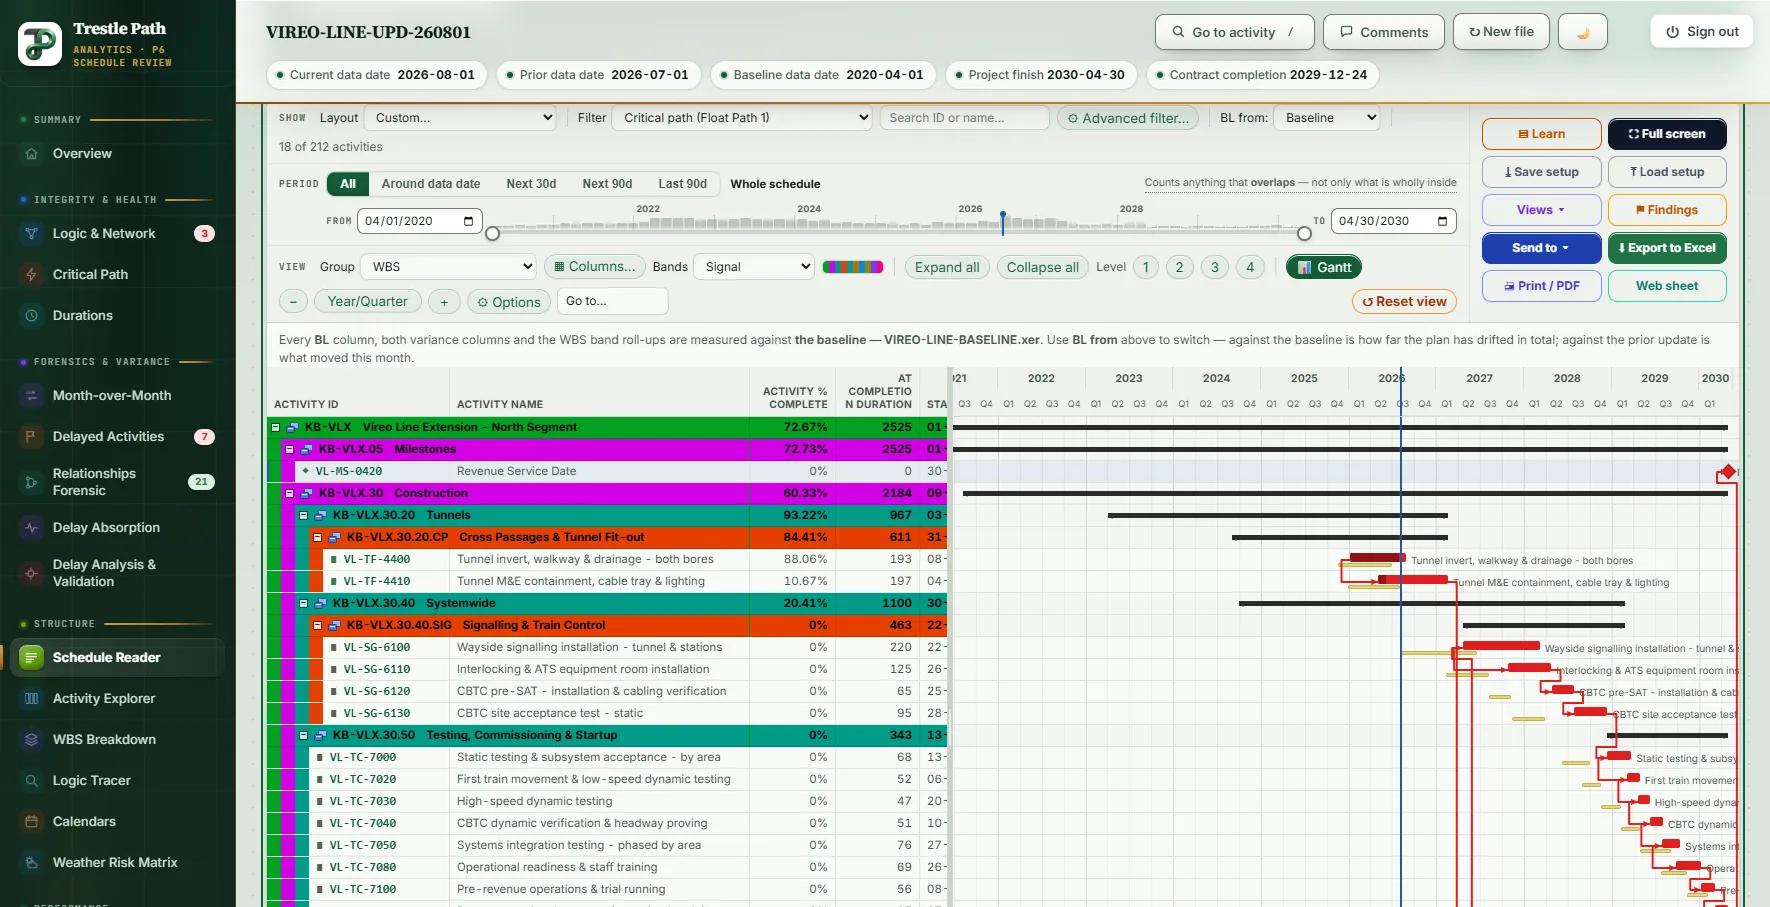
The Critical path (Float Path 1) filter returns 18 activities: tunnel fit-out, signalling, the testing sequence, three activities of a new delay event (Impact 11) and Revenue Service Date. Longest Path, P6's stored flag, returns 17. Total float ≤ 0 returns nine. The difference is instructive. Eight testing activities sit on ten-hour-day calendars with 1.5 hours of total float, 0.15 of a day, which a whole-day display reads as zero and an exact filter does not; and the tunnel invert carries 25 hours of float on its twenty-hour tunnelling calendar. A float threshold would have missed half the critical path.
What changed underneath it
Grouped by Calendar, the update shows a calendar that did not exist in July: KB-TC7 7x10 Commissioning Recovery, a seven-day, ten-hour calendar carrying six testing activities, five of them on the critical path. Moving critical work onto a seven-day calendar buys back days without a logic change, which is exactly the kind of change a narrative has to explain. The driving chain into Revenue Service Date holds 18 activities this month against 15 in July: the three Impact 11 activities are new to it, and they are the subject of the general comment in the log.
The drawer shows how the chain holds together. Interlocking & ATS equipment room installation (VL-SG-6110) is driven by the wayside signalling installation through an SS +130 day link; its other two predecessors do not drive it, one of them by 243 days.
Progress that barely moved
With BL from: Prior update, the cross-passage linings (VL-CP-4300) stand out: a month ago they had seven days to go; now they are 95 per cent complete with six days to go, a month later. One day of progress in a month on nearly finished work is a question, and the activity's resource assignments, in the Activity Explorer, show why: fewer actual tunnelling hours than in July. Previously reported progress should not change without an explanation, so it is raised as non-compliant, with the facts frozen beside it, ready for the comment log.
Twenty-two activities are behind the baseline by the Delayed vs Baseline test. In the next 90 days, 30 activities are at work. Grouped by float band, only three carry ten days or less: the project-management level of effort and the tunnel M&E fit-out at zero, and the tunnel invert near-critical; four carry 10 to 44 days and the other 23 more than 44.
Keyboard
| Key | What it does |
|---|---|
| ↑ ↓, PgUp PgDn, Home End | Move one row, twenty rows, or to the first or last row |
| Enter | Open the activity's drawer, or fold and unfold a band |
| Space | Select the row's bar in the chart |
| / | Jump to the search box |
| F | Full screen; Esc leaves it, closing an open drawer first |
| Ctrl+K | Go to any activity by ID or part of its name, from anywhere in the product |
Header clicks sort ascending, descending, then off; dragging a title moves the column, dragging its edge resizes it and a double-click on the edge resets it.
Limits
- It reads, it never edits. Nothing on the page changes the schedule; a correction is a comment, not an edit.
- No cost fields. Resources appear as a grouping and in the drawer; quantities and curves belong to Resource Performance.
- Fixed thresholds on the quick filters. Near-critical is up to ten days and long and high-float are over 44 days, following common practice rather than a standard; the chart's near-critical threshold can be set for the project.
- Sizes. The A3 print takes up to 2,500 activities and the web sheet 6,000; the Excel outline holds seven levels. The screen has no row limit.
- Microsoft Project XML carries no activity codes and no notebook. Its custom fields appear as user-defined columns, its Unique ID is the key, and the prior update and baseline must be Project files too.
Where to find it
The Schedule Reader is included in every plan, from Reader up, and in the fourteen-day trial; a Reader plan opens on it. Current prices are on the pricing page. To open an XER for the first time, see how to read an XER without P6; for the flat, filterable list of the same activities, see the Activity Explorer. The section's own guide, under Learn in the product, covers every control.
Fourteen days free
Try it on your own schedule
Fourteen days free, no credit card, every section open. Your XER or XML file is read in your browser and never uploaded; only anonymous numbers reach the calculation service, and nothing is stored.
RelatedThe Activity ExplorerHow to open an XER without P6Critical path, longest path and float paths