
Why a logically sound schedule can still be unbuildable
Logic tests, float tests and the DCMA checks look at how a schedule is built. None of them asks whether the asphalt is planned for January. A paving train in a month below placement temperature, embankment fill into a frozen subgrade, an in-stream crossing outside the fisheries window, girder erection through the storm season: each is a plan that cannot be delivered as drawn, and each looks perfectly healthy in a logic report.
The question has three parts, and they are worth keeping apart. Is the work planned into bad weather? That is exposure. Can it move the completion date? That depends on float. Did the plan already allow for it? That is the calendars against the contract. A seasonal review that answers only the first part tends to flag work that does not matter and miss the activity five days from losing a whole season.
Where the work is built decides which months are red
South-coast British Columbia is constrained by an October-to-March wet season and a spring freshet; Ontario and the Prairies by deep frost and a December-to-March cold; the US Gulf and south Atlantic coast by a June-to-November hurricane season no northern region carries. The same activity in the same month is exposed in one region and favourable in another, and nothing in a schedule file says where the project is.
So the page asks first. It opens on a setup step that proposes the project type from the mix of work it finds and the location from place names in the activity names, the WBS, the project name and the file name, each marked as a suggestion. Nothing is scored until you confirm both. There is no default region: the comprehensive workbook, the report composer and the printable report all say "not scored" until the location is confirmed.
Counting working days, not activities
Counting activities that start or finish in a winter month says little: a 60-day activity that starts in October and finishes in March works through the whole winter, and an activity on a calendar that closes for the season works none of it. The page counts what actually matters:
- One work type per activity. Each unfinished physical activity is classified into one of 27 work types (paving, earthwork, concrete, piling, in-stream, steel and precast erection, trackwork, shafts, dewatering and so on), from its name first, then its WBS, then its activity codes. Design, submittals, procurement, permits, cures and holds, milestones and level of effort are set aside.
- Working days on the activity's own calendar. Each activity is walked day by day from where its remaining work starts to its finish, and every working day is filed under its month.
- What the calendar already carries. A seasonal closure or a weather-allowance day is counted as carried by the calendar, not as exposure; a statutory holiday is neither.
- A band per work type, per month. Red, amber or green from the confirmed region's climate normals (Environment and Climate Change Canada; NOAA / NCEI), using the drivers that stop that kind of work: temperature, wet months, the freshet, the thaw, heat, the in-water window, the storm and tropical seasons.
Six questions
| Question | What the page counts | Why a reviewer cares |
|---|---|---|
| Where does the remaining work meet bad weather? | Working days in red months, with the ones on Float Path 1 and within 10 days of it split out | Weather on work with float to spare does not move completion; weather on the critical path does |
| How close is the season cliff? | Working days a critical activity can slip before it reaches a red month, a calendar closure or a window edge | A slip across a seasonal closure costs the season, not the days |
| What moved since last month? | Activities whose red-month days went up against the prior update, both plans counted from this data date | A schedule that drifts into winter one month at a time never shows one large movement |
| Is work outside its window? | Working days outside the in-water, bird-nesting and paving windows you confirm | The permit and the specification set the dates, not the climate |
| Is normal weather allowed for? | Each weather-sensitive calendar against the contract's monthly table of expected adverse days | Only weather beyond the contract's table is potentially excusable |
| What is not classified yet? | Physical activities no work type matched, decided one at a time or a WBS branch at once | What cannot be recognised cannot be tested |
Running it
- Load the XER (or MS Project XML), with the prior update beside it if you have one. Open Weather Risk Matrix.
- Step 1: check the suggested project type and location against the contract, change either if it is wrong, and confirm. A saved setup from last month does this in one click.
- Read the six tiles, then the matrix. Switch it to Critical & near-critical to see only the days that can move completion.
- Confirm the window rules with the dates the permits and the specification give, and enter the contract's table of expected adverse days.
- Decide the activities in Not classified, save the setup, and export the workbook.
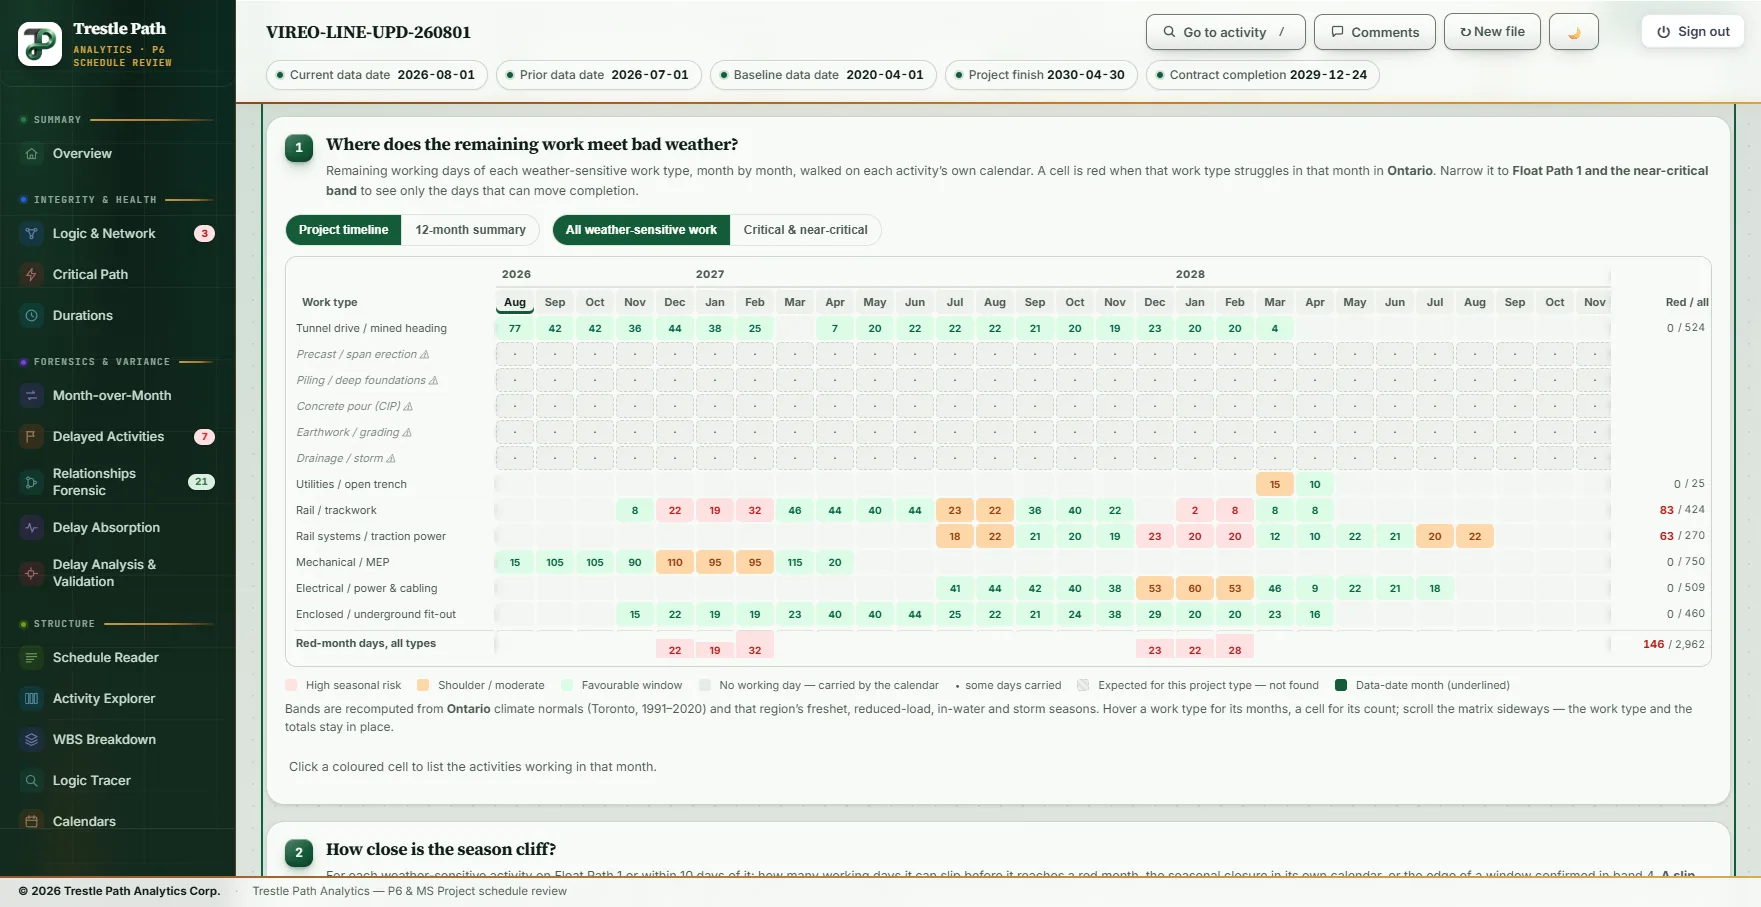
Worked example: a metro extension
The Vireo Line Extension is a fictional twin-bore metro extension with five underground stations, supplied with the product as a demonstration set; nothing in it is real. The August 2026 update was reviewed with the July update beside it.
Step 1 suggests no location: the names in the file are invented, so no place the page knows appears in them, and both the country and the province or state are left for the reviewer to choose. It suggests Rail / transit as the project type, a weak match (55 per cent, with tunnel and underground next at 49), which is about right for a job that is mostly tunnel, station fit-out and systems. For this walk-through the location was confirmed as Ontario — Toronto.
The page found 25 unfinished weather-sensitive activities carrying 2,962 remaining working days, set aside 18 activities as design, procurement, permits and other desk work, and listed 22 physical activities it could not classify: the architectural and MEP fit-out of the five stations, the testing and commissioning sequence, and two delay events. A reviewer decides those in a few minutes, a whole WBS branch at a time; the station fit-out is underground and the testing is not weather work.
| Activity | Work type | Red-month working days | Total float |
|---|---|---|---|
| Plinth and first-stage concrete, both bores | Rail / trackwork | 60 · Dec 2026 to Feb 2027 | 48 d |
| Third rail installation and bonding, both bores | Rail systems / traction power | 63 · Dec 2027 to Feb 2028 | 127 d |
| Direct-fixation track installation, both bores | Rail / trackwork | 13 · Feb 2027 | 127 d |
| Tie-in to the operating line | Rail / trackwork | 10 · Jan to Feb 2028 | 89 d |
That is 146 red-month working days across four activities, and none of them on the critical path. Float Path 1 carries 571 remaining weather-sensitive working days, all of them tunnel, underground fit-out, signalling and cabling work whose work types have no red month in Ontario. The honest finding is therefore not "146 days of weather risk": it is that the weather exposure sits on trackwork and traction power with 48 to 127 days of float, and that the plinth concrete, with the least float, is planned through its first winter. The season cliff band shows no critical activity within a year of a cliff, and nothing moved into red months since July.
Change the location and the picture changes with it. Confirmed as British Columbia, scored on Vancouver's normals, the same schedule has no red-month day at all: trackwork is limited by frost, and the south coast rarely freezes.
Limits
- Climate normals are not a forecast. A 30-year average says what a month usually does; the page tests whether the plan respects the usual season, not this year's.
- One location per project. A long linear job that crosses climate zones is scored against the one region confirmed for it.
- Classification reads the schedule's text. It is as good as the activity names, the WBS and the codes; the not-classified list and your decisions close the gap, and they travel in the saved setup.
- The bands are judgement. The temperature and wet-month limits are reasonable planning limits for a review, not specification limits; where a permit or a specification sets a window, enter it as a rule.
- Excusability is a contract question. The page shows what is planned against the season and against the contract's own table of normal weather; whether a weather delay is excusable turns on the contract's words.
Where to find it
The Weather Risk Matrix is included in the Analyst and Expert plans and in the fourteen-day trial. Current prices are on the pricing page. The section's guide covers the method in full, with a worked example of the season cliff and the bands for every work type.
Fourteen days free
Try it on your own schedule
Fourteen days free, no credit card, every section open. Your XER or XML file is read in your browser and never uploaded; only anonymous numbers reach the calculation service, and nothing is stored.
RelatedA sample schedule reviewLinear schedules from a P6 filePlans and pricing