
What the test measures
Total float and absorption capacity answer two different questions. Total float is P6's own figure from its backward pass: how far the activity can slip before the first late date in front of it is breached. Absorption capacity is how far it can slip before this milestone's date changes. The two part company whenever something binds in between: float that comes from the other end of the activity, a second path that takes over, a constraint, or calendars of different lengths meeting.
The test is not a forecast. It measures how much room the plan has today, as submitted, for one delay at a time. That is the question a reviewer is asked every week: does this hold-up matter yet, and how much will it cost when it does?
Setting up a run
- Schedule. Choose Current, Prior or Baseline. Switching keeps your activity and milestone where they exist in the other file and names any that do not. The result on screen is cleared and the export disabled, so a Current result is never read or exported as a Prior one.
- Stress range. The default is 500 working days. The sweep re-runs the network at every step, up to 600 steps: a range of 1,000 working days is tested in steps of 1.7, and the page says so.
- Delay type. Takes longer adds the slip to the activity's duration: its finish moves, its start holds, so only work tied to its finish (finish-to-start, finish-to-finish) feels it. Starts late moves the whole activity, so work tied to its start (start-to-start) feels it too.
- Activity under stress. Any activity that is not complete and not level of effort, found by ID or name. Critical-path activities carry a CRIT tag; Select Random picks one for you.
- Milestone being protected. Any activity. The list opens with the milestones, latest first, and the latest milestone is the default.
- Press Run stress test.
Two rules decide the delay type for you. Only work that has not started can start late: an activity in progress has an actual start, which is history, so Starts late is switched off for it and its tooltip gives the actual start date. And a milestone has no duration to take longer: when it slips, its date moves, so for a milestone under stress Takes longer is switched off and the run is a late start.
How the re-schedule works
The first pass, with no delay, reproduces the file's own dates. Every later pass adds the injected slip to the stressed activity and carries it forward through each downstream activity on that activity's own calendar, read by calendar id: weekly patterns, holidays, shutdowns and working exceptions, with the time of day carried from one calendar to the next by the clock. Delay is handled in hours, as P6 stores it: one injected day is the stressed calendar's hours-per-day, used up through each date's actual working hours. Lags follow the lag-calendar option the file was scheduled with.
The re-schedule holds mandatory constraints only. That is deliberate: a delay pushes early dates later, and a finish-on-or-before date does not stop an early date moving, it turns float negative. Level-of-effort and WBS-summary activities are left out, as P6 leaves them out of the critical path.
The units differ on purpose. Delay is injected in working days on the stressed activity's calendar, because that is how work is lost. The milestone's movement is read in calendar days, as a date, because that is what a contract date is. A milestone counts as moved when its date changes; a slip that moves it later within the same day does not count. The capacity is the last step at which the milestone had not moved. If the file carries no usable calendars, the page falls back to a straight line from total float and says so in its basis panel.
The same engine, run backwards, measures recovery on the Delay Analysis & Validation page: how many calendar days shortening in-progress work on the controlling chain would return at the milestone.
Reading the result
The verdict banner comes first. It depends on the stress range you chose, so a verdict is always a verdict on that range.
| Verdict | When the page gives it |
|---|---|
| Fully absorbed | The milestone does not move anywhere in the tested range |
| Transmits immediately | The milestone moves at the first step: no capacity at all |
| Sensitive | The capacity is less than a quarter of the tested range |
| Resilient | The capacity is a quarter of the range or more |
Four tiles follow: the absorption capacity; the date the milestone holds until; the movement at the full range with the projected finish; and the transmission rate, the calendar days of milestone slip per further working day beyond the capacity. A five-day week alone gives about 1.4; above 1.2 the tile turns orange.
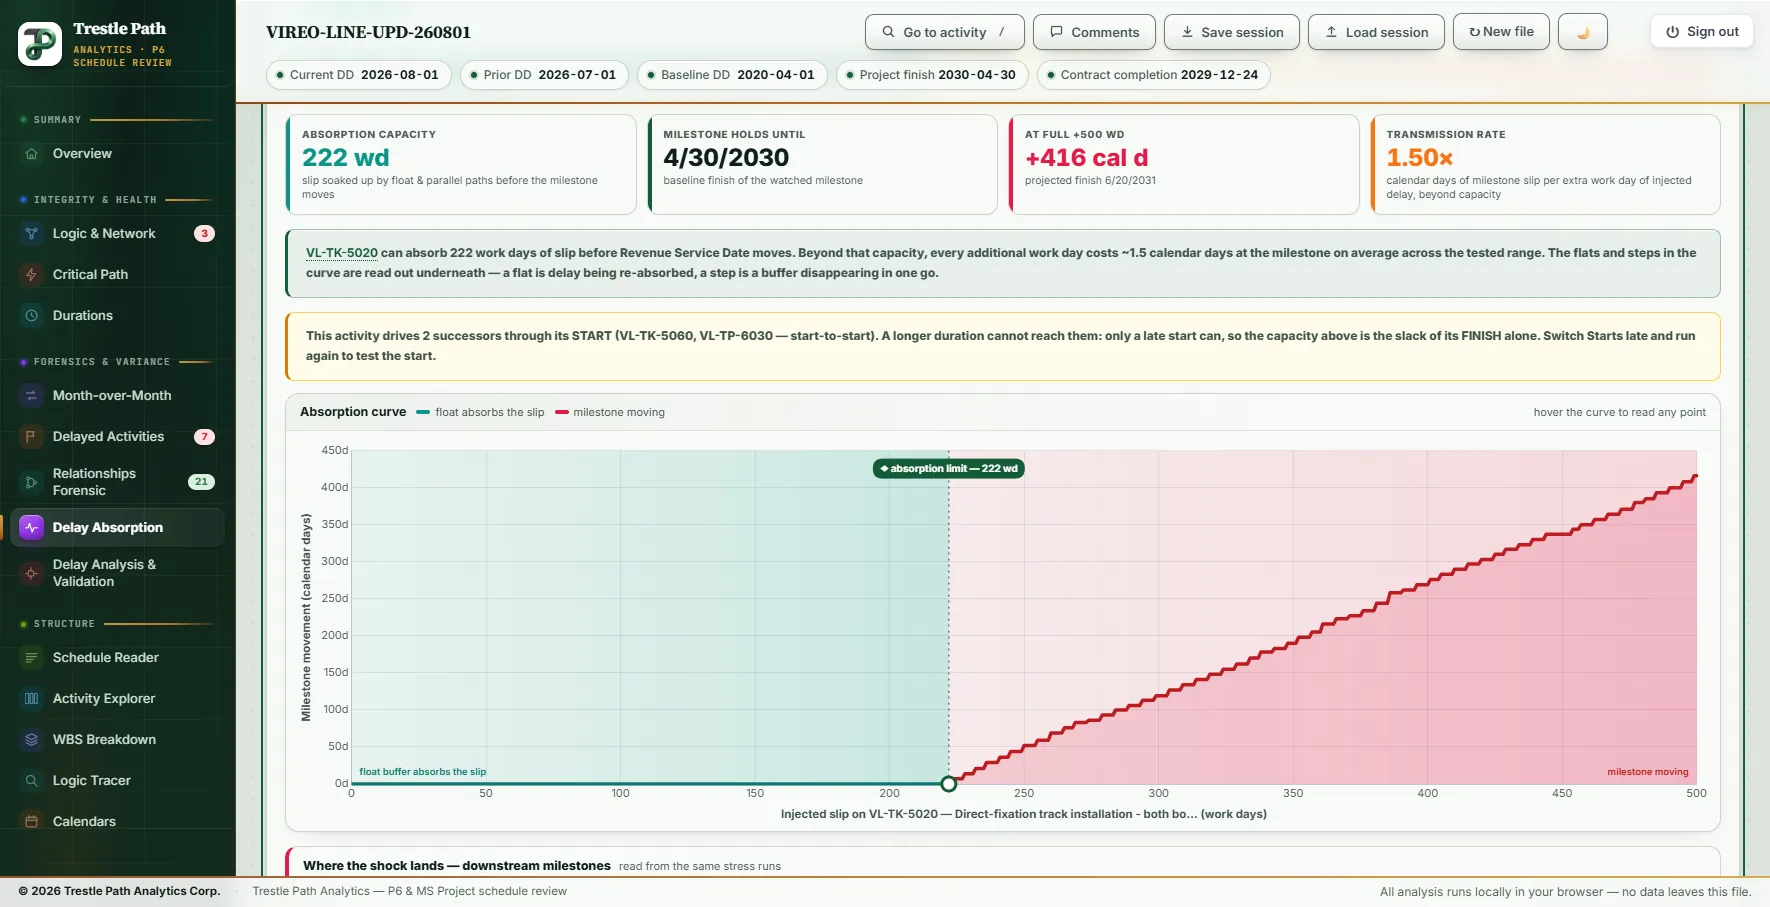
The curve plots milestone movement against injected slip, teal while float absorbs it and rose once the milestone moves, with a dotted line at the absorption limit. Under it, What this means, in plain English reads the curve in phases and names its shape. A single step of a quarter of the total movement or more (or 60 calendar days and 15 per cent) is a cliff; two or more steps of 15 per cent are a staircase; a single step of 8 per cent and five days is worth naming; anything less is gradual. The headline prints the size and share of each step it names, so you can argue with the cut; the cuts are judgement, not doctrine. A jump is put down to a calendar closure only when the closure brackets it; otherwise the page says the buffer ran out.
Four more blocks carry the reviewer's evidence:
- Where the shock lands: up to ten unfinished downstream milestones, read from the same runs, each with its own capacity, its slip at the full range and its projected finish. First thing to feel it names the one that moves soonest.
- What limits this activity: the successor chain that sets its total float, followed by the least relationship total float to a constraint, a zero-float activity or the end of the chain, and, where the capacity exceeds the total float, a short ladder from "reaches zero float" to "begins to move".
- How much is this capacity worth?: every activity between the two that has no successor tied to its finish. Work after such an activity waits only for it to start, so the capacity is an upper bound until the finish is tied. Milestones are never counted: a milestone is one point in time, so a link out of its start is a link out of its finish.
- A warning when the stressed activity drives work through its start, which a longer duration cannot reach.
Worked example: a metro extension's August update
The Vireo Line Extension is a fictional twin-bore metro extension with five underground stations, supplied with the product as a demonstration set; nothing in it is real. These runs are on the August 2026 update (data date 2026-08-01), protecting the Revenue Service Date (VL-MS-0420, 2030-04-30), with a stress range of 500 working days (wd).
| Activity under stress | Total float | Delay type | Capacity | Verdict | Milestone at +500 wd |
|---|---|---|---|---|---|
| VL-TC-7060 Emergency ventilation & fire life safety demonstration | 10 d | Takes longer | 13 wd | Sensitive | +714 cal d |
| VL-TK-5020 Direct-fixation track installation | 127 d | Takes longer | 222 wd | Resilient | +416 cal d |
| VL-TK-5020, the same activity | 127 d | Starts late | 130 wd | Resilient | +541 cal d |
| VL-SG-6100 Wayside signalling installation | 0 d | Takes longer | 38 wd | Sensitive | +679 cal d |
| VL-SG-6100, the same activity | 0 d | Starts late | 3 wd | Sensitive | +727 cal d |
| VL-MS-0230 Tunnel handed over for trackwork (a milestone) | 48 d | Its date moves | 51 wd | Sensitive | +658 cal d |
| VL-HL-3120 Architectural & MEP rough-in, Halyard Street | 66 d | Takes longer | over 500 wd | Fully absorbed | no move |
Capacity is not total float
The fire life safety demonstration carries 10 days of total float and absorbs 13 working days. Three working days sit at the very end of every chain into this milestone: the trial running activity (VL-TC-7100), on a seven-day calendar with 1.5 working hours of float, absorbs three on its own. It finishes just before a weekend that its seven-day calendar works and the five-day calendar after it does not, and the milestone counts as moved only when its date changes. The demonstration is also not the milestone to watch first. First thing to feel it names Systems integration testing complete (VL-MS-0400), which starts moving after 2 working days of slip.
Where the float sits decides the delay type
The track installation shows 127 days of total float, and taking longer it absorbs 222 working days. The 127 days come from its start: a start-to-start link with a 104-day lag into third-rail installation (VL-TP-6030), which carries 127 days itself. A longer duration never touches that link, and the page says so in the amber note. Run again with Starts late and the capacity falls to 130 working days. Track installation complete (VL-MS-0300) starts moving after one working day either way.
On the critical path, the start is what matters
The wayside signalling installation is on the critical path with no float, yet taking longer it absorbs 38 working days. It drives the interlocking installation (VL-SG-6110) through a start-to-start link with a 130-day lag; its own finish feeds the next activity with time to spare. A late start reaches the critical path at once, and the capacity falls to the 3 working days every chain here carries at its end.
A milestone moves as a date
Tunnel handed over for trackwork is a milestone, so Takes longer is switched off and the run moves its date: 51 working days before the Revenue Service Date moves. Four station fit-out milestones and Track installation complete start moving after 2 working days.
A flat line can be a missing link
The Halyard Street rough-in absorbs the whole 500 working days. It is in progress, so it cannot start late, and its only successors are tied to its start (SS +80 and SS +120). The page refuses the flattering reading: "This result is about the logic, not about resilience." Seven unfinished activities in this update have no successor tied to their finish, and three of them are testing activities on the critical path (VL-TC-7000, VL-TC-7030 and VL-TC-7050). That is why the track installation result says to treat its 222 working days as an upper bound.
Month to month
Run the fire life safety demonstration on the Prior schedule and it has 154 days of total float and 155 working days of capacity: resilient. The July update had the Revenue Service Date on 2030-07-17. In August the date came forward to 2030-04-30 and the critical testing activities moved onto a new seven-day calendar, while the demonstration stayed on the five-day testing calendar. Its capacity fell to 13 working days. On the 2020 baseline it was 160.
The what-if workbook
Export What-If Report (Excel) is live once a test has run and writes what you ran, never the other schedule's result. It has six sheets:
| Sheet | What it carries |
|---|---|
| Executive Summary | The inputs, including the delay type and the engine; capacity, verdict, rate and maximum movement; the finding in words; the five downstream milestones most at risk |
| Absorption Curve | The curve as data and as a native Excel line chart, with up to three downstream milestones beside it |
| Scenario Analysis | A ladder of up to fourteen injected delays around the capacity, read off the same curve: within capacity or not, slip, projected finish and a severity (minor below 7 calendar days, moderate below 21, major from 21), a column chart, and a matrix of every downstream milestone at every scenario |
| Downstream Impact | The protected milestone and the downstream milestones with capacity, slip and projected finish |
| Plain English | The same reading of the curve as the screen, the logic check, and the first milestone to feel it |
| Methodology | Units, total float, constraints, exclusions, what limits the activity, and why absorbed is not permitted |
The file is named for the data date, the project and the stressed activity, for example 2026-08-01 - KB-VLX - Delay Absorption Report (VL-TC-7060).xlsx.
Limits
- One delay at a time, on the schedule as submitted. Two delays together can interact, and a contractor who re-sequences in response will usually do better than the curve. Resources, acceleration and mitigation are not modelled.
- Absorbed is not permitted. Capacity is what the network will absorb, not what anyone is entitled to use. Who owns float is a contract question.
- Not a time impact analysis. It is a prospective what-if in the spirit of AACE 52R-06: insert, re-schedule, measure at a named milestone. It is a cross-check, not a substitute for a formal analysis, and not a retrospective method under AACE 29R-03. For those, see the delay analysis guide.
- A date, not an hour. The milestone counts as moved when its date changes, so capacity can exceed the hours of float shown on critical work.
- Missing ties make the answer optimistic. The page lists them; it never invents the logic to correct the number.
- Steps above 600. A range above 600 working days is tested in larger steps: the same demonstration reads 12 working days at a range of 1,000.
Where to find it
Delay Absorption is a module: included in the Expert plan, available as an add-on to Reader or Analyst, and open in the fourteen-day trial. Current prices are on the pricing page. It reads a P6 XER or an MS Project XML. On the page, Never read one of these before? Start here explains the curve in plain words, and Basis of calculation sets out the units, calendars and exclusions behind every number. To see why an activity drives what it drives, open it in the Logic Tracer.
Fourteen days free
Try it on your own schedule
Fourteen days free, no credit card, every section open. Your XER or XML file is read in your browser and never uploaded; only anonymous numbers reach the calculation service, and nothing is stored.
RelatedCritical path, longest path and float pathsSchedule delay analysis from P6 updatesTracing P6 logic